

Question: PART A - only provide the three correct values - do not sketch graph. Construct a 95% confidence interval for the true mean. Sketch the

PART A - only provide the three correct values - do not sketch graph.
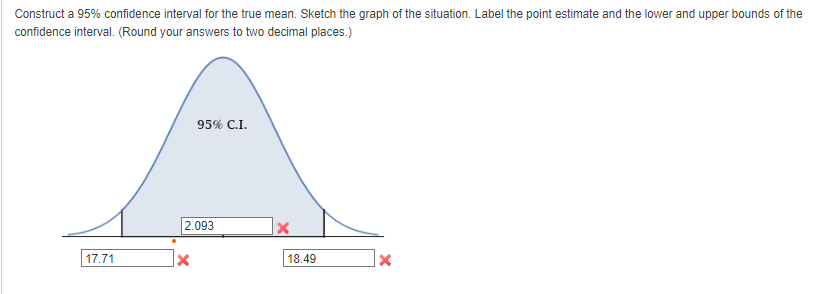
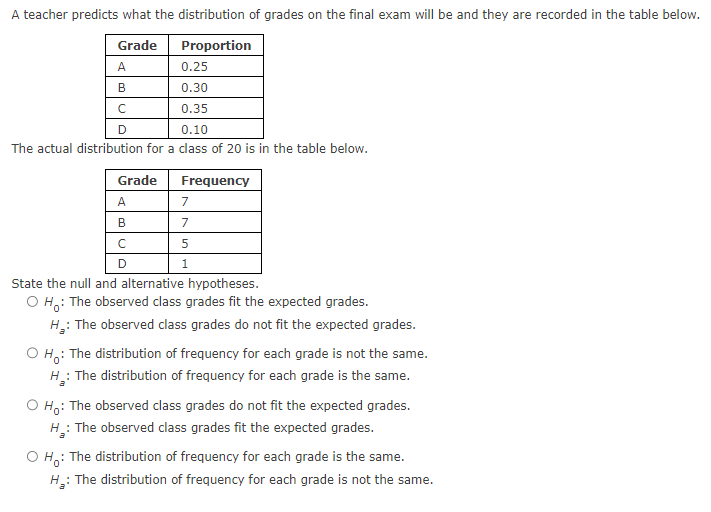


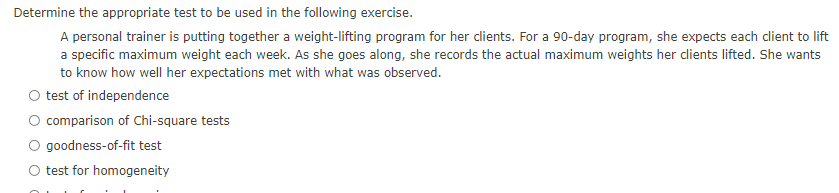
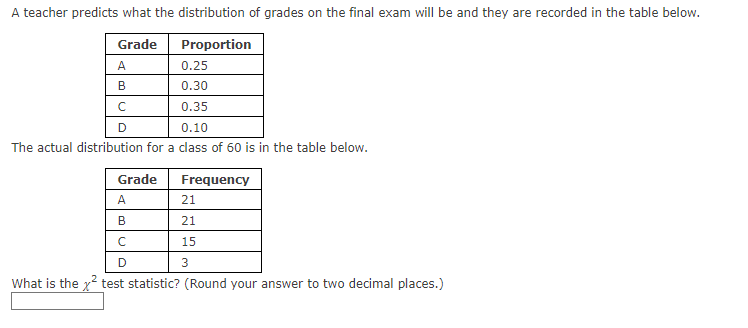
Construct a 95% confidence interval for the true mean. Sketch the graph of the situation. Label the point estimate and the lower and upper bounds of the confidence interval. (Round your answers to two decimal places.) 95% C.I. 2.093 X 17.71 X 18.49 XA teacher predicts what the distribution of grades on the final exam will be and they are recorded in the table below. Grade Proportion A 0.25 0.30 C 0.35 D 0.10 The actual distribution for a class of 20 is in the table below. Grade Frequency A 7 B 7 C 5 D 1 State the null and alternative hypotheses. O H: The observed class grades fit the expected grades. He: The observed class grades do not fit the expected grades. O H: The distribution of frequency for each grade is not the same. H_: The distribution of frequency for each grade is the same. O H: The observed class grades do not fit the expected grades. H_: The observed class grades fit the expected grades. O H : The distribution of frequency for each grade is the same. He: The distribution of frequency for each grade is not the same.Determine the appropriate test to be used in the following exercise. A personal trainer is putting together a weight-lifting program for her clients. For a ElIIIZI-dai,f program, she expects each client to lift a specic maximum weight each week. As she goes along, she records the actual maximum weights her clients lifted. She wants to know how well her expectations met with what was observed. 0 test of independence 0 comparison of Chi-square tests O goodness-of-t test O test for homogeneityr n . . r - I A teacher predicts what the distribution of grades on the final exam will be and they are recorded in the table below. Grade Proportion A 0.25 B 0.30 C 0.35 D 0.10 The actual distribution for a class of 60 is in the table below. Grade Frequency A 21 B 21 C 15 D 3 What is the ytest statistic? (Round your answer to two decimal places.)A chi-square goodness-of-fit test produces a P-value of 0.06. Which of the following conclusions is appropriate? O Reject the alternate hypothesis at a = 0.05 level. O Fail to reject the null hypothesis at a = 0.05 level. O Reject the null hypothesis at a = 0.05 level. O Accept the null hypothesis at a = 0.05 level
Step by Step Solution
There are 3 Steps involved in it

Get step-by-step solutions from verified subject matter experts