

Question: Part (a) was to plot a histogram using R from data -csv here is the plot. Taxi Fare Amount 15000 20000 Frequency 10000 5000 0
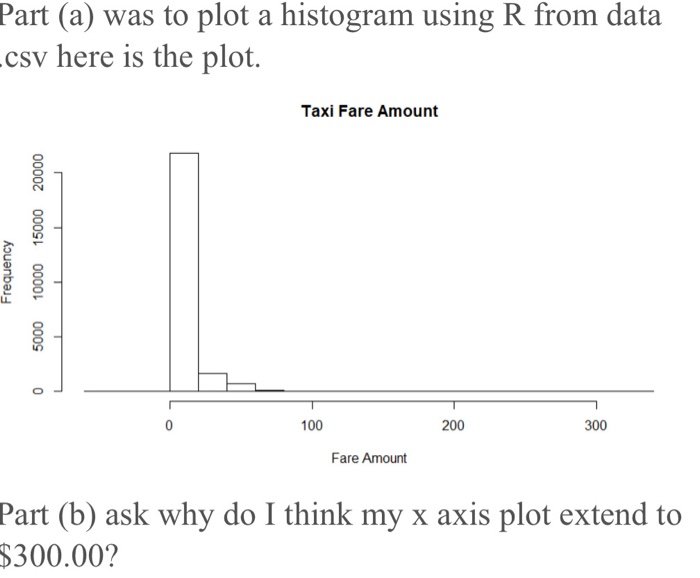
Part (a) was to plot a histogram using R from data -csv here is the plot. Taxi Fare Amount 15000 20000 Frequency 10000 5000 0 100 200 300 Fare Amount Part (b) ask why do I think my x axis plot extend to $300.00
Step by Step Solution
There are 3 Steps involved in it
1 Expert Approved Answer
Step: 1 Unlock

Question Has Been Solved by an Expert!
Get step-by-step solutions from verified subject matter experts
Step: 2 Unlock
Step: 3 Unlock