

Question: Part A What is the upper control limit for the R-chart? Part B Is the R-chart in control or out of control? Part C What
Part A
What is the upper control limit for the R-chart?
Part B
Is the R-chart in control or out of control?
Part C
What is the upper control limit for the X-bar chart?
Part D
What is the lower control limit for the X-chart chart?
Part E
Is the X-bar chart in control or out of control?
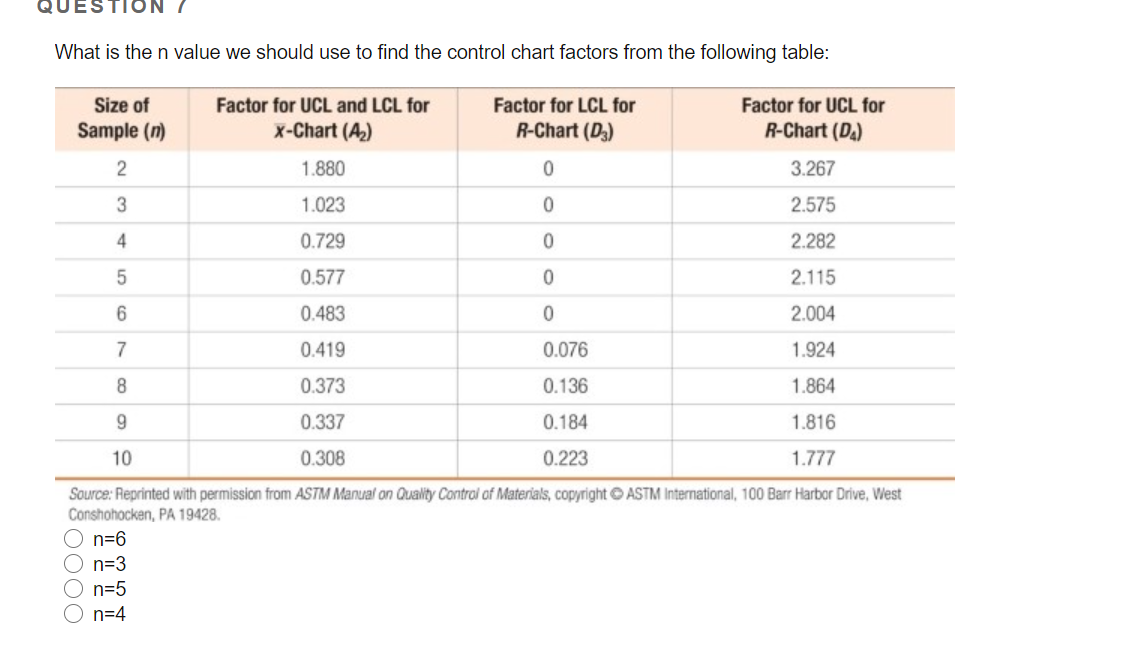
QUESTION / What is the n value we should use to find the control chart factors from the following table: Size of Sample (n) Factor for UCL and LCL for X-Chart (A) Factor for LCL for R-Chart (D) Factor for UCL for R-Chart (D) 2 1.880 0 3.267 3 1.023 0 2.575 4 0.729 0 2.282 5 0.577 0 2.115 6 0.483 0 2.004 7 0.419 0.076 1.924 8 0.373 0.136 1.864 9 0.337 0.184 1.816 10 0.308 0.223 1.777 OOOO Source: Reprinted with permission from ASTM Manual on Quality Control of Materials, copyright ASTM International, 100 Barr Harbor Drive, West Conshohocken, PA 19428. n=6 O n=3 n=5 n=4 QUESTION / What is the n value we should use to find the control chart factors from the following table: Size of Sample (n) Factor for UCL and LCL for X-Chart (A) Factor for LCL for R-Chart (D) Factor for UCL for R-Chart (D) 2 1.880 0 3.267 3 1.023 0 2.575 4 0.729 0 2.282 5 0.577 0 2.115 6 0.483 0 2.004 7 0.419 0.076 1.924 8 0.373 0.136 1.864 9 0.337 0.184 1.816 10 0.308 0.223 1.777 OOOO Source: Reprinted with permission from ASTM Manual on Quality Control of Materials, copyright ASTM International, 100 Barr Harbor Drive, West Conshohocken, PA 19428. n=6 O n=3 n=5 n=4
Step by Step Solution
There are 3 Steps involved in it
1 Expert Approved Answer
Step: 1 Unlock

Question Has Been Solved by an Expert!
Get step-by-step solutions from verified subject matter experts
Step: 2 Unlock
Step: 3 Unlock