

Question: Part B. (18.5 points) This question requires your detailed calculation. Please write the equations and the additional assumption(s) if there is any. You should also
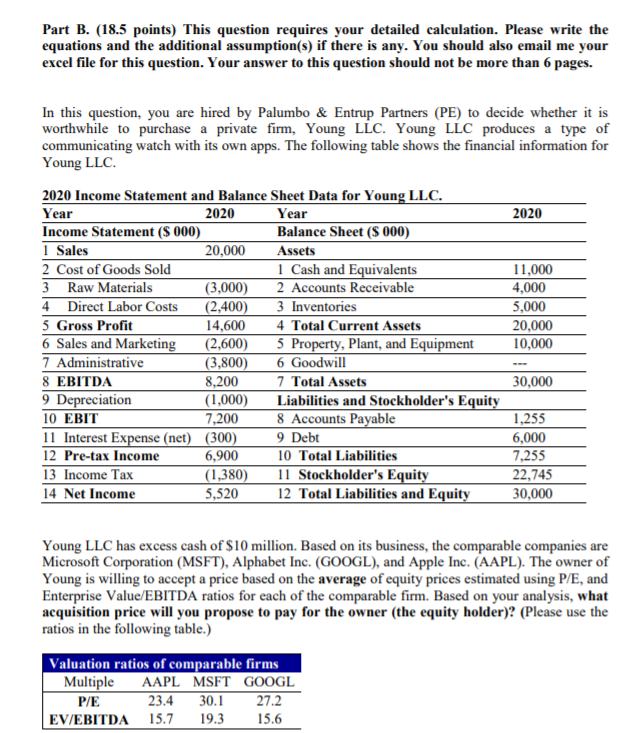
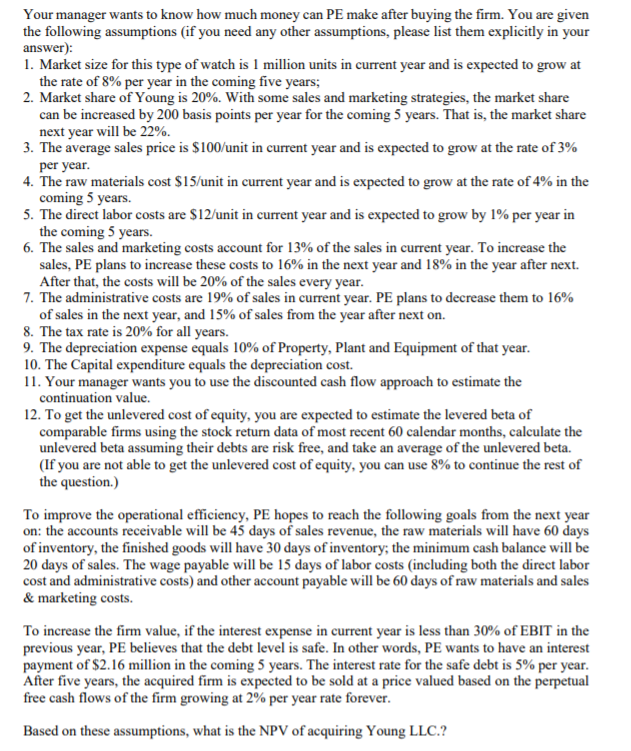
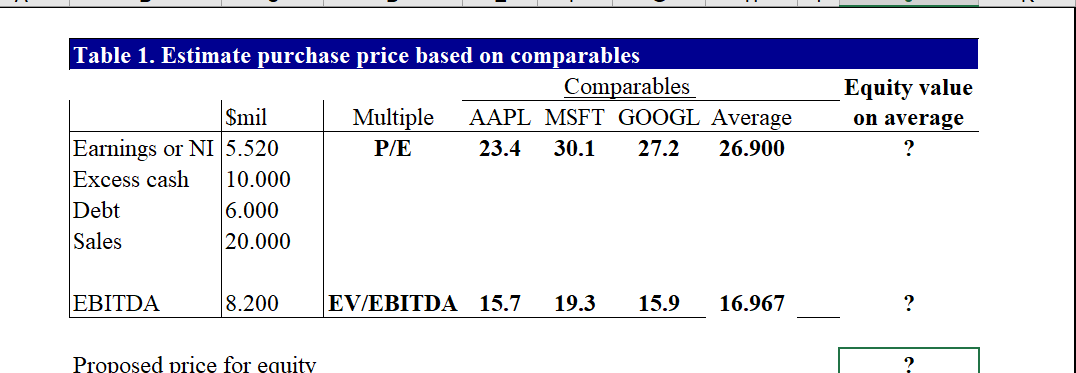
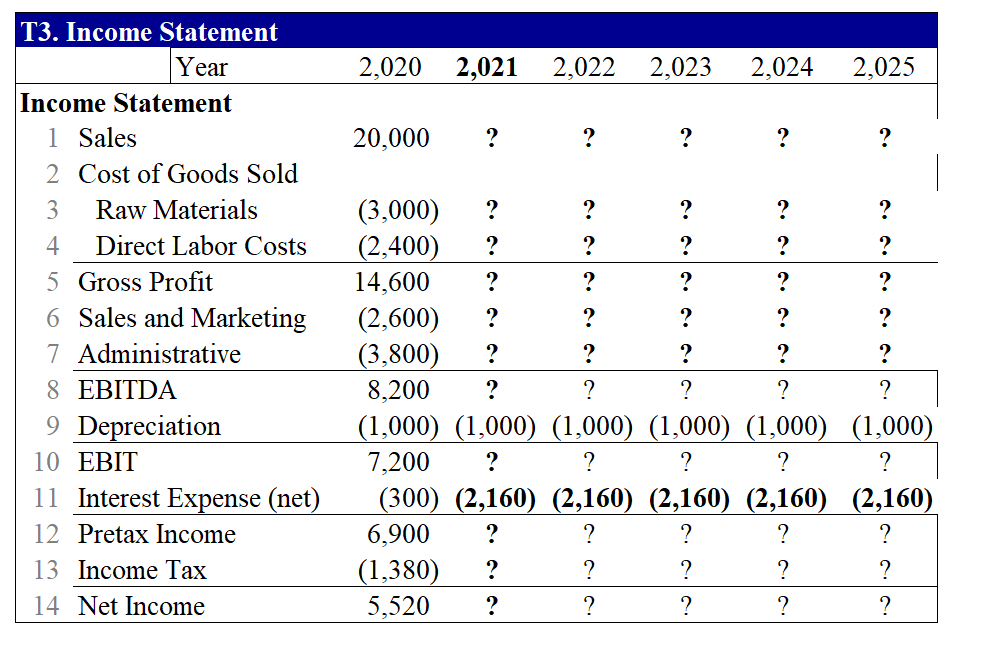
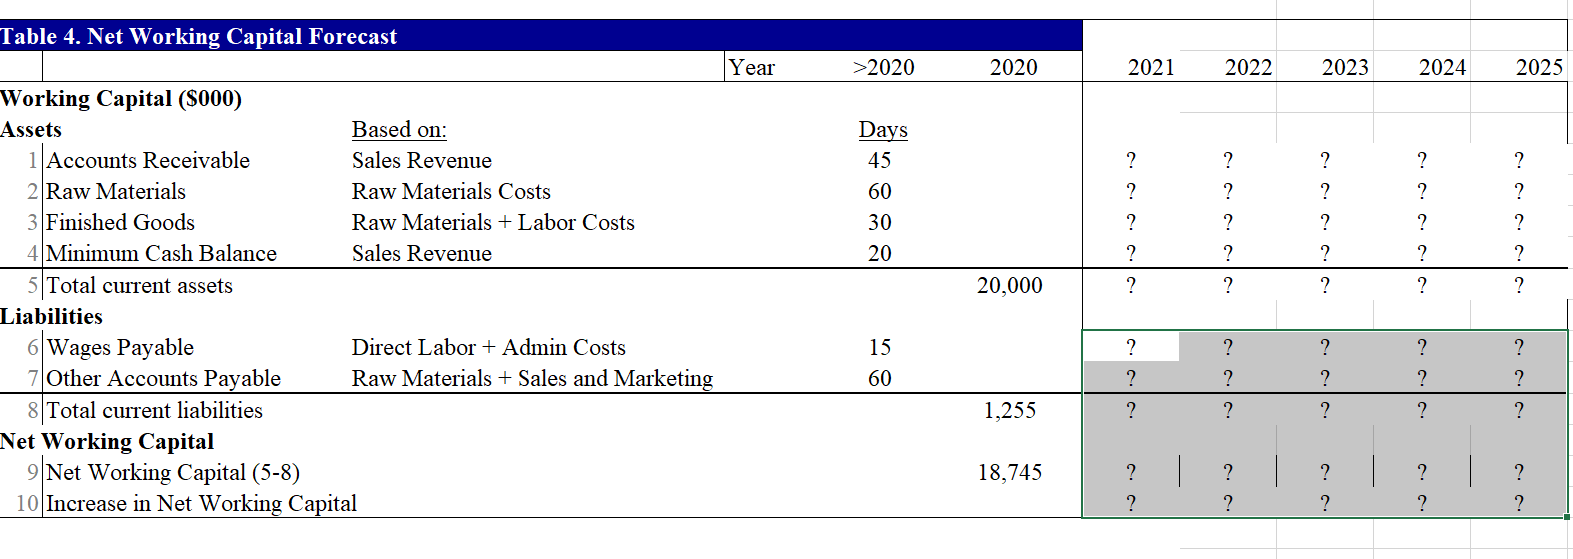
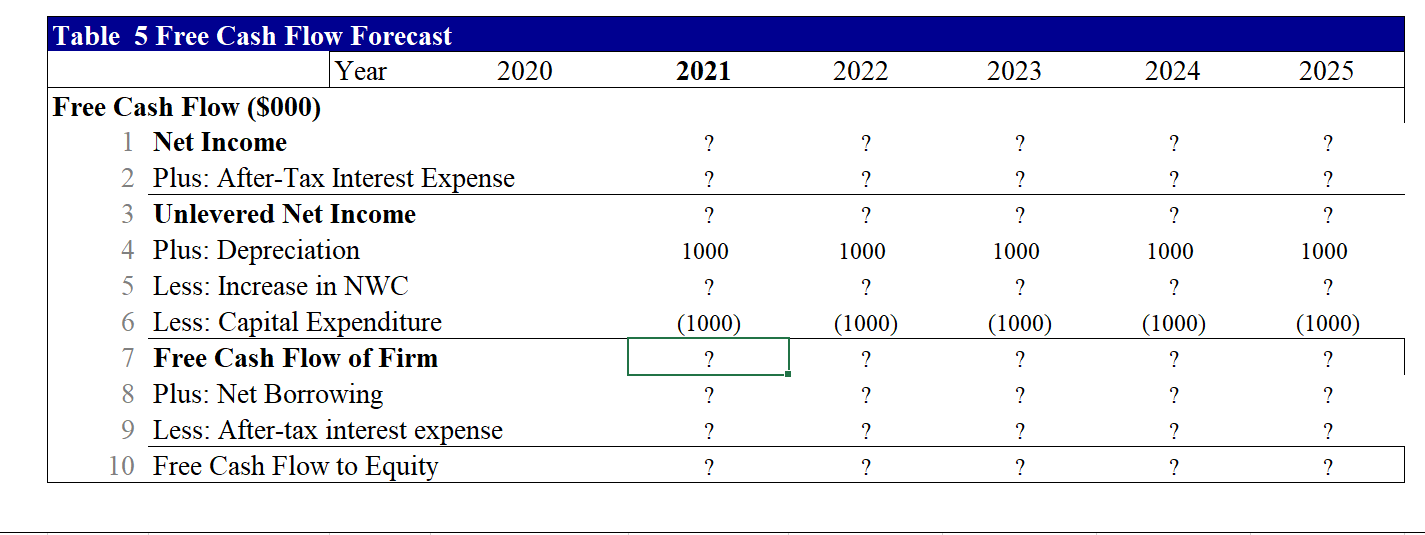
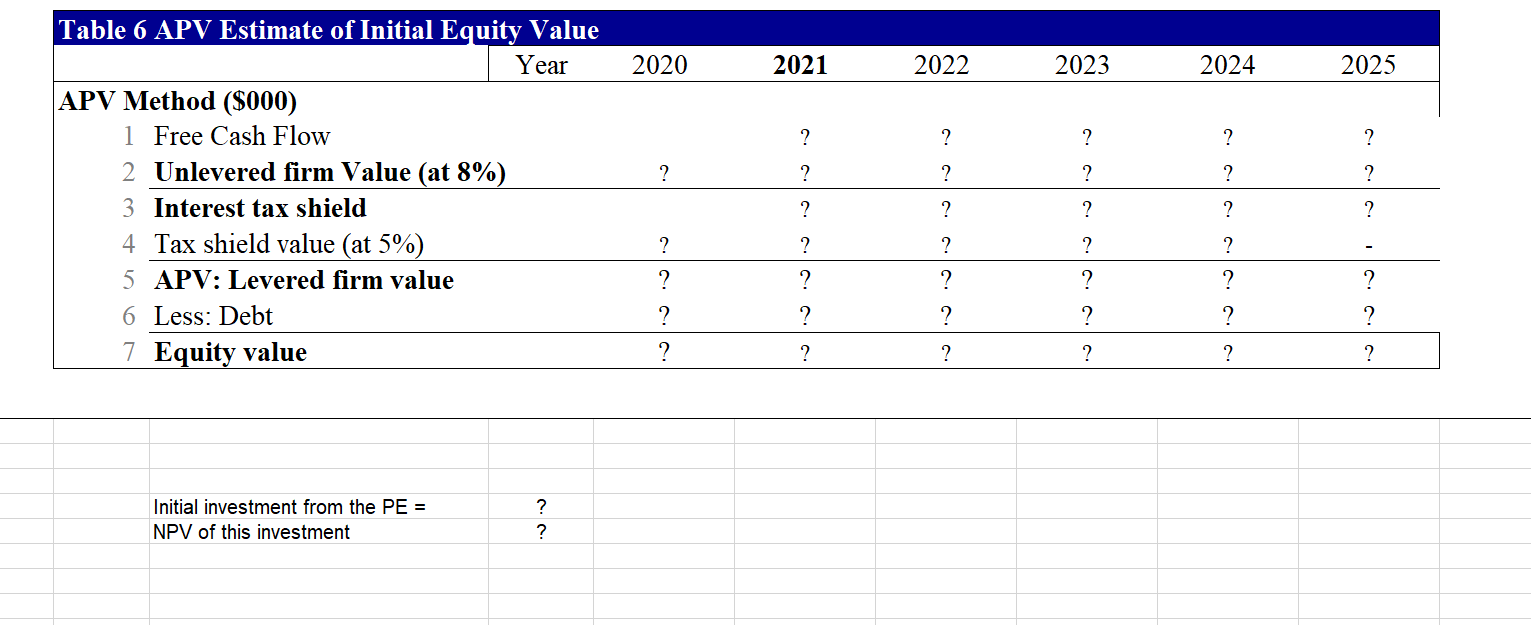
Part B. (18.5 points) This question requires your detailed calculation. Please write the equations and the additional assumption(s) if there is any. You should also email me your excel file for this question. Your answer to this question should not be more than 6 pages. In this question, you are hired by Palumbo & Entrup Partners (PE) to decide whether it is worthwhile to purchase a private firm, Young LLC. Young LLC produces a type of communicating watch with its own apps. The following table shows the financial information for Young LLC. 2020 2020 Income Statement and Balance Sheet Data for Young LLC. Year 2020 Year Income Statement ($ 000) Balance Sheet (8 000) 1 Sales 20,000 Assets 2 Cost of Goods Sold 1 Cash and Equivalents 3 Raw Materials (3,000) 2 Accounts Receivable 4 Direct Labor Costs (2,400) 3 Inventories 5 Gross Profit 14,600 4 Total Current Assets 6 Sales and Marketing (2,600) 5 Property, Plant, and Equipment 7 Administrative (3,800) 6 Goodwill 8 EBITDA 8,200 7 Total Assets 9 Depreciation (1,000) Liabilities and Stockholder's Equity 10 EBIT 7,200 8 Accounts Payable 11 Interest Expense (net) (300) 9 Debt 12 Pre-tax Income 6,900 10 Total Liabilities 13 Income Tax (1,380) 11 Stockholder's Equity 14 Net Income 5,520 12 Total Liabilities and Equity 11,000 4,000 5,000 20,000 10,000 30,000 1,255 6,000 7,255 22,745 30,000 Young LLC has excess cash of $10 million. Based on its business, the comparable companies are Microsoft Corporation (MSFT), Alphabet Inc. (GOOGL), and Apple Inc. (AAPL). The owner of Young is willing to accept a price based on the average of equity prices estimated using PE, and Enterprise Value/EBITDA ratios for each of the comparable firm. Based on your analysis, what acquisition price will you propose to pay for the owner (the equity holder)? (Please use the ratios in the following table.) Valuation ratios of comparable firms Multiple AAPL MSFT GOOGL P/E 23.4 30.1 27.2 EV/EBITDA 15.7 19.3 15.6 Your manager wants to know how much money can PE make after buying the firm. You are given the following assumptions (if you need any other assumptions, please list them explicitly in your answer): 1. Market size for this type of watch is 1 million units in current year and is expected to grow at the rate of 8% per year in the coming five years; 2. Market share of Young is 20%. With some sales and marketing strategies, the market share can be increased by 200 basis points per year for the coming 5 years. That is, the market share next year will be 22%. 3. The average sales price is $100/unit in current year and is expected to grow at the rate of 3% per year. 4. The raw materials cost $15/unit in current year and is expected to grow at the rate of 4% in the coming 5 years. 5. The direct labor costs are $12/unit in current year and is expected to grow by 1% per year in the coming 5 years. 6. The sales and marketing costs account for 13% of the sales in current year. To increase the sales, PE plans to increase these costs to 16% in the next year and 18% in the year after next. After that, the costs will be 20% of the sales every year. 7. The administrative costs are 19% of sales in current year. PE plans to decrease them to 16% of sales in the next year, and 15% of sales from the year after next on. 8. The tax rate is 20% for all years. 9. The depreciation expense equals 10% of Property, Plant and Equipment of that year. 10. The Capital expenditure equals the depreciation cost. 11. Your manager wants you to use the discounted cash flow approach to estimate the continuation value. 12. To get the unlevered cost of equity, you are expected to estimate the levered beta of comparable firms using the stock return data of most recent 60 calendar months, calculate the unlevered beta assuming their debts are risk free, and take an average of the unlevered beta. (If you are not able to get the unlevered cost of equity, you can use 8% to continue the rest of the question.) To improve the operational efficiency, PE hopes to reach the following goals from the next year on: the accounts receivable will be 45 days of sales revenue, the raw materials will have 60 days of inventory, the finished goods will have 30 days of inventory; the minimum cash balance will be 20 days of sales. The wage payable will be 15 days of labor costs (including both the direct labor cost and administrative costs) and other account payable will be 60 days of raw materials and sales & marketing costs. To increase the firm value, if the interest expense in current year is less than 30% of EBIT in the previous year, PE believes that the debt level is safe. In other words, PE wants to have an interest payment of $2.16 million in the coming 5 years. The interest rate for the safe debt is 5% per year. After five years, the acquired firm is expected to be sold at a price valued based on the perpetual free cash flows of the firm growing at 2% per year rate forever. Based on these assumptions, what is the NPV of acquiring Young LLC.? Equity value on average Table 1. Estimate purchase price based on comparables Comparables Smil Multiple AAPL MSFT GOOGL Average Earnings or NI 5.520 P/E 23.4 30.1 27.2 26.900 Excess cash 10.000 Debt 6.000 Sales 20.000 ? EBITDA 8.200 EV/EBITDA 15.7 19.3 15.9 16.967 ? Proposed price for equity ? 2021 2022 2023 2024 2025 ? ? ? ? 22.00% 24.00% 26.00% 28.00% 30.00% ? ? ? ? ? Table 2 Sales and costs forecast Year 2020 Sales Data Growth/Year 1 Market Size (000 units) 8.00% 1,000 2 Market Share 2.00% 20.00% 3 Average Sales Price ($/unit) 3.00% 100.00 Cost of Goods Data 4 Raw Materials ($/unit) 4.00% 15.00 5 Direct Labor Costs ($/unit) 1.00% 12.00 Operating Expense and Tax Data 6 Sales and Marketin % sales) 13.00% 7 Administrative (% sales) 19.00% 8 Tax Rate 20.00% ? ? ? ? ? 16.00% 16.00% 20.00% 18.00% 15.00% 20.00% 20.00% 15.00% 20.00% 20.00% 15.00% 20.00% 20.00% 15.00% 20.00% T3. Income Statement Year 2,020 2,021 2,022 2,023 2,024 2,025 20,000 ? ? ? ? ? ? ? Income Statement 1 Sales 2 Cost of Goods Sold 3 Raw Materials 4 Direct Labor Costs 5 Gross Profit 6 Sales and Marketing 7 Administrative 8 EBITDA 9 Depreciation 10 EBIT 11 Interest Expense (net) 12 Pretax Income 13 Income Tax 14 Net Income ? ? ? ? ? ? ? ? ? ? (3,000) ? ? ? (2,400) ? ? ? ? 14,600 ? ? ? ? ? (2,600) ? ? ? (3,800) ? 8,200 ? (1,000) (1,000) (1,000) (1,000) (1,000) (1,000) 7,200 (300) (2,160) (2,160) (2,160) (2,160) (2,160) 6,900 (1,380) ? 5,520 ? ? ? ? ? ? ? ? ? ? ? ? ? ? ? ? ? ? ? Table 4. Net Working Capital Forecast Year >2020 2020 2021 2022 2023 2024 2025 c. ? ? Days 45 60 30 20 ? ? ? ? ? ? ? ? ? ? ? ? ? ? ? ? ? ? 20,000 ? ? ? ? Working Capital (5000) Assets Based on: 1 Accounts Receivable Sales Revenue 2 Raw Materials Raw Materials Costs 3 Finished Goods Raw Materials + Labor Costs 4 Minimum Cash Balance Sales Revenue 5 Total current assets Liabilities 6 Wages Payable Direct Labor + Admin Costs 7 Other Accounts Payable Raw Materials + Sales and Marketing 8 Total current liabilities Net Working Capital 9 Net Working Capital (5-8) 10 Increase in Net Working Capital 15 ? ? 60 ? ? ? ? ? ? ? ? ? ? 1.255 ? ? 18,745 ? ? ? ? ? ? ? ? ? ? Table 5 Free Cash Flow Forecast Year 2020 2021 2022 2023 2024 2025 ? ? ? ? ? ? ? ? ? ? ? ? ? ? ? 1000 1000 1000 1000 1000 Free Cash Flow ($000) 1 Net Income 2 Plus: After-Tax Interest Expense 3 Unlevered Net Income 4 Plus: Depreciation 5 Less: Increase in NWC 6 Less: Capital Expenditure 7 Free Cash Flow of Firm 8 Plus: Net Borrowing 9 Less: After-tax interest expense 10 Free Cash Flow to Equity ? ? ? ? ? (1000) (1000) (1000) (1000) (1000) ? ? ? ? ? ? ? ? ? ? ? ? ? c. ? ? ? ? ? 2020 2021 2022 2023 2024 2025 ? ? ? ? ? ? ? ? ? Table 6 APV Estimate of Initial Equity Value Year APV Method ($000) 1 Free Cash Flow 2 Unlevered firm Value (at 8%) 3 Interest tax shield 4 Tax shield value (at 5%) 5 APV: Levered firm value 6 Less: Debt 7 Equity value ? ? ? ? ? ? ? ? ? ? ? ? ? ? ? ? ? ? ? ? 2 ? ? ? ? ? ? ? ? Initial investment from the PE = NPV of this investment con Part B. (18.5 points) This question requires your detailed calculation. Please write the equations and the additional assumption(s) if there is any. You should also email me your excel file for this question. Your answer to this question should not be more than 6 pages. In this question, you are hired by Palumbo & Entrup Partners (PE) to decide whether it is worthwhile to purchase a private firm, Young LLC. Young LLC produces a type of communicating watch with its own apps. The following table shows the financial information for Young LLC. 2020 2020 Income Statement and Balance Sheet Data for Young LLC. Year 2020 Year Income Statement ($ 000) Balance Sheet (8 000) 1 Sales 20,000 Assets 2 Cost of Goods Sold 1 Cash and Equivalents 3 Raw Materials (3,000) 2 Accounts Receivable 4 Direct Labor Costs (2,400) 3 Inventories 5 Gross Profit 14,600 4 Total Current Assets 6 Sales and Marketing (2,600) 5 Property, Plant, and Equipment 7 Administrative (3,800) 6 Goodwill 8 EBITDA 8,200 7 Total Assets 9 Depreciation (1,000) Liabilities and Stockholder's Equity 10 EBIT 7,200 8 Accounts Payable 11 Interest Expense (net) (300) 9 Debt 12 Pre-tax Income 6,900 10 Total Liabilities 13 Income Tax (1,380) 11 Stockholder's Equity 14 Net Income 5,520 12 Total Liabilities and Equity 11,000 4,000 5,000 20,000 10,000 30,000 1,255 6,000 7,255 22,745 30,000 Young LLC has excess cash of $10 million. Based on its business, the comparable companies are Microsoft Corporation (MSFT), Alphabet Inc. (GOOGL), and Apple Inc. (AAPL). The owner of Young is willing to accept a price based on the average of equity prices estimated using PE, and Enterprise Value/EBITDA ratios for each of the comparable firm. Based on your analysis, what acquisition price will you propose to pay for the owner (the equity holder)? (Please use the ratios in the following table.) Valuation ratios of comparable firms Multiple AAPL MSFT GOOGL P/E 23.4 30.1 27.2 EV/EBITDA 15.7 19.3 15.6 Your manager wants to know how much money can PE make after buying the firm. You are given the following assumptions (if you need any other assumptions, please list them explicitly in your answer): 1. Market size for this type of watch is 1 million units in current year and is expected to grow at the rate of 8% per year in the coming five years; 2. Market share of Young is 20%. With some sales and marketing strategies, the market share can be increased by 200 basis points per year for the coming 5 years. That is, the market share next year will be 22%. 3. The average sales price is $100/unit in current year and is expected to grow at the rate of 3% per year. 4. The raw materials cost $15/unit in current year and is expected to grow at the rate of 4% in the coming 5 years. 5. The direct labor costs are $12/unit in current year and is expected to grow by 1% per year in the coming 5 years. 6. The sales and marketing costs account for 13% of the sales in current year. To increase the sales, PE plans to increase these costs to 16% in the next year and 18% in the year after next. After that, the costs will be 20% of the sales every year. 7. The administrative costs are 19% of sales in current year. PE plans to decrease them to 16% of sales in the next year, and 15% of sales from the year after next on. 8. The tax rate is 20% for all years. 9. The depreciation expense equals 10% of Property, Plant and Equipment of that year. 10. The Capital expenditure equals the depreciation cost. 11. Your manager wants you to use the discounted cash flow approach to estimate the continuation value. 12. To get the unlevered cost of equity, you are expected to estimate the levered beta of comparable firms using the stock return data of most recent 60 calendar months, calculate the unlevered beta assuming their debts are risk free, and take an average of the unlevered beta. (If you are not able to get the unlevered cost of equity, you can use 8% to continue the rest of the question.) To improve the operational efficiency, PE hopes to reach the following goals from the next year on: the accounts receivable will be 45 days of sales revenue, the raw materials will have 60 days of inventory, the finished goods will have 30 days of inventory; the minimum cash balance will be 20 days of sales. The wage payable will be 15 days of labor costs (including both the direct labor cost and administrative costs) and other account payable will be 60 days of raw materials and sales & marketing costs. To increase the firm value, if the interest expense in current year is less than 30% of EBIT in the previous year, PE believes that the debt level is safe. In other words, PE wants to have an interest payment of $2.16 million in the coming 5 years. The interest rate for the safe debt is 5% per year. After five years, the acquired firm is expected to be sold at a price valued based on the perpetual free cash flows of the firm growing at 2% per year rate forever. Based on these assumptions, what is the NPV of acquiring Young LLC.? Equity value on average Table 1. Estimate purchase price based on comparables Comparables Smil Multiple AAPL MSFT GOOGL Average Earnings or NI 5.520 P/E 23.4 30.1 27.2 26.900 Excess cash 10.000 Debt 6.000 Sales 20.000 ? EBITDA 8.200 EV/EBITDA 15.7 19.3 15.9 16.967 ? Proposed price for equity ? 2021 2022 2023 2024 2025 ? ? ? ? 22.00% 24.00% 26.00% 28.00% 30.00% ? ? ? ? ? Table 2 Sales and costs forecast Year 2020 Sales Data Growth/Year 1 Market Size (000 units) 8.00% 1,000 2 Market Share 2.00% 20.00% 3 Average Sales Price ($/unit) 3.00% 100.00 Cost of Goods Data 4 Raw Materials ($/unit) 4.00% 15.00 5 Direct Labor Costs ($/unit) 1.00% 12.00 Operating Expense and Tax Data 6 Sales and Marketin % sales) 13.00% 7 Administrative (% sales) 19.00% 8 Tax Rate 20.00% ? ? ? ? ? 16.00% 16.00% 20.00% 18.00% 15.00% 20.00% 20.00% 15.00% 20.00% 20.00% 15.00% 20.00% 20.00% 15.00% 20.00% T3. Income Statement Year 2,020 2,021 2,022 2,023 2,024 2,025 20,000 ? ? ? ? ? ? ? Income Statement 1 Sales 2 Cost of Goods Sold 3 Raw Materials 4 Direct Labor Costs 5 Gross Profit 6 Sales and Marketing 7 Administrative 8 EBITDA 9 Depreciation 10 EBIT 11 Interest Expense (net) 12 Pretax Income 13 Income Tax 14 Net Income ? ? ? ? ? ? ? ? ? ? (3,000) ? ? ? (2,400) ? ? ? ? 14,600 ? ? ? ? ? (2,600) ? ? ? (3,800) ? 8,200 ? (1,000) (1,000) (1,000) (1,000) (1,000) (1,000) 7,200 (300) (2,160) (2,160) (2,160) (2,160) (2,160) 6,900 (1,380) ? 5,520 ? ? ? ? ? ? ? ? ? ? ? ? ? ? ? ? ? ? ? Table 4. Net Working Capital Forecast Year >2020 2020 2021 2022 2023 2024 2025 c. ? ? Days 45 60 30 20 ? ? ? ? ? ? ? ? ? ? ? ? ? ? ? ? ? ? 20,000 ? ? ? ? Working Capital (5000) Assets Based on: 1 Accounts Receivable Sales Revenue 2 Raw Materials Raw Materials Costs 3 Finished Goods Raw Materials + Labor Costs 4 Minimum Cash Balance Sales Revenue 5 Total current assets Liabilities 6 Wages Payable Direct Labor + Admin Costs 7 Other Accounts Payable Raw Materials + Sales and Marketing 8 Total current liabilities Net Working Capital 9 Net Working Capital (5-8) 10 Increase in Net Working Capital 15 ? ? 60 ? ? ? ? ? ? ? ? ? ? 1.255 ? ? 18,745 ? ? ? ? ? ? ? ? ? ? Table 5 Free Cash Flow Forecast Year 2020 2021 2022 2023 2024 2025 ? ? ? ? ? ? ? ? ? ? ? ? ? ? ? 1000 1000 1000 1000 1000 Free Cash Flow ($000) 1 Net Income 2 Plus: After-Tax Interest Expense 3 Unlevered Net Income 4 Plus: Depreciation 5 Less: Increase in NWC 6 Less: Capital Expenditure 7 Free Cash Flow of Firm 8 Plus: Net Borrowing 9 Less: After-tax interest expense 10 Free Cash Flow to Equity ? ? ? ? ? (1000) (1000) (1000) (1000) (1000) ? ? ? ? ? ? ? ? ? ? ? ? ? c. ? ? ? ? ? 2020 2021 2022 2023 2024 2025 ? ? ? ? ? ? ? ? ? Table 6 APV Estimate of Initial Equity Value Year APV Method ($000) 1 Free Cash Flow 2 Unlevered firm Value (at 8%) 3 Interest tax shield 4 Tax shield value (at 5%) 5 APV: Levered firm value 6 Less: Debt 7 Equity value ? ? ? ? ? ? ? ? ? ? ? ? ? ? ? ? ? ? ? ? 2 ? ? ? ? ? ? ? ? Initial investment from the PE = NPV of this investment con
Step by Step Solution
There are 3 Steps involved in it

Get step-by-step solutions from verified subject matter experts