

Question: Part B a. Recall that the scale in your spectroscope did not give any unit of measure, making it an arbitrary scale. Because the scale
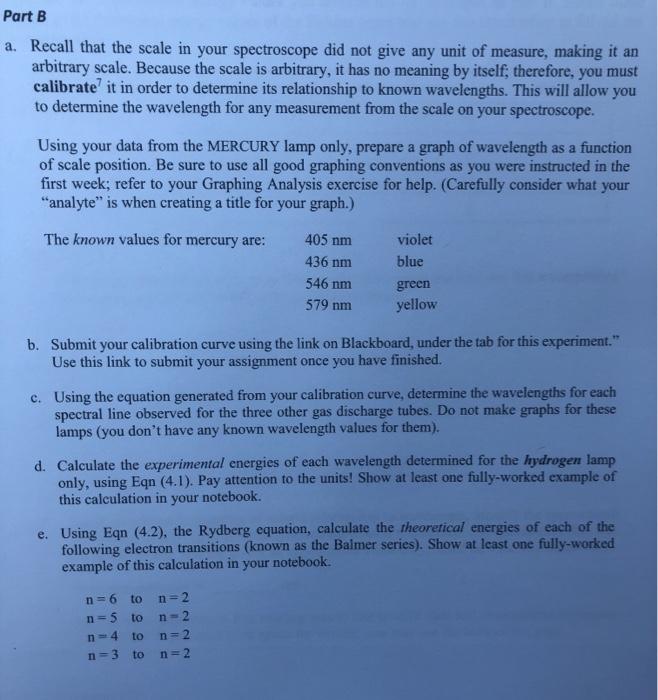
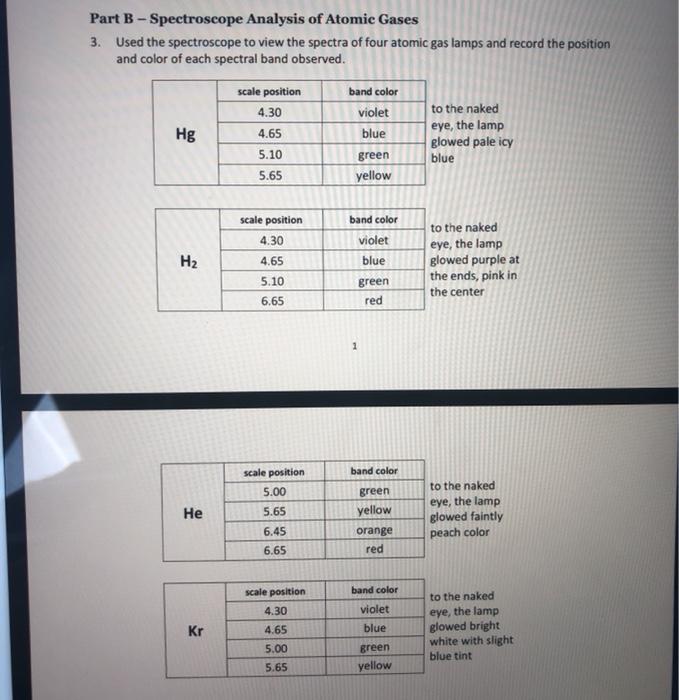
Part B a. Recall that the scale in your spectroscope did not give any unit of measure, making it an arbitrary scale. Because the scale is arbitrary, it has no meaning by itself; therefore, you must calibrate it in order to determine its relationship to known wavelengths. This will allow you to determine the wavelength for any measurement from the scale on your spectroscope. Using your data from the MERCURY lamp only, prepare a graph of wavelength as a function of scale position. Be sure to use all good graphing conventions as you were instructed in the first week; refer to your Graphing Analysis exercise for help. (Carefully consider what your "analyte" is when creating a title for your graph.) The known values for mercury are: violet blue 405 nm 436 nm 546 nm 579 nm green yellow b. Submit your calibration curve using the link on Blackboard, under the tab for this experiment." Use this link to submit your assignment once you have finished. c. Using the equation generated from your calibration curve, determine the wavelengths for each spectral line observed for the three other gas discharge tubes. Do not make graphs for these lamps (you don't have any known wavelength values for them). d. Calculate the experimental energies of each wavelength determined for the hydrogen lamp only, using Eqn (4.1). Pay attention to the units! Show at least one fully-worked example of this calculation in your notebook. e. Using Eqn (4.2), the Rydberg equation, calculate the theoretical energies of each of the following electron transitions (known as the Balmer series). Show at least one fully-worked example of this calculation in your notebook. n=6 to n=2 n-5 to n-2 n-4 to n=2 n=3 to n=2
Step by Step Solution
There are 3 Steps involved in it

Get step-by-step solutions from verified subject matter experts