

Question: Part B Compute and Interpret Ratios Selected balance sheet and income statement information from Illinois Tool Works follows. S millions 2019 2018 2017 Net operating
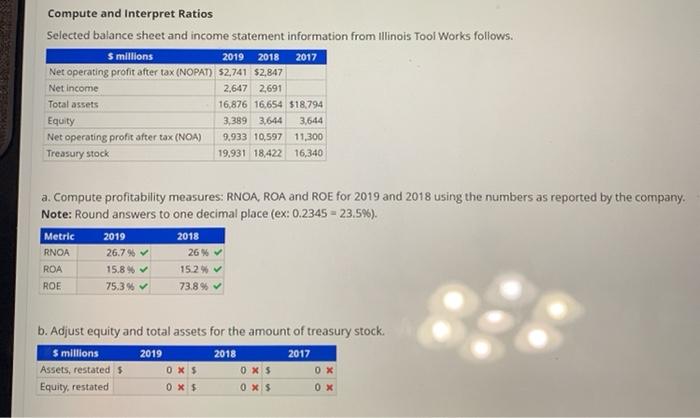
Compute and Interpret Ratios Selected balance sheet and income statement information from Illinois Tool Works follows. S millions 2019 2018 2017 Net operating profit after tax (NOPAT) 52,741 $2,847 Net income 2,647 2,691 Total assets 16,876 16,654 $18.794 Equity 3,389 3,644 3,644 Net operating profit after tax (NOA) 9.933 10.597 11,300 Treasury stock 19,931 18,422 16,340 2019 a. Compute profitability measures: RNOA, ROA and ROE for 2019 and 2018 using the numbers as reported by the company. Note: Round answers to one decimal place (ex: 0.2345 = 23.5%). 2018 26% 15.2% 73.8% Metric RNOA ROA 26.796 15.8% 75.3% ROE b. Adjust equity and total assets for the amount of treasury stock S millions 2019 2018 2017 Assets, restated $ 0 X5 0 X 5 OX Equity, restated OXS 0 X 5 OX Compute and Interpret Ratios Selected balance sheet and income statement information from Illinois Tool Works follows. S millions 2019 2018 2017 Net operating profit after tax (NOPAT) 52,741 $2,847 Net income 2,647 2,691 Total assets 16,876 16,654 $18.794 Equity 3,389 3,644 3,644 Net operating profit after tax (NOA) 9.933 10.597 11,300 Treasury stock 19,931 18,422 16,340 2019 a. Compute profitability measures: RNOA, ROA and ROE for 2019 and 2018 using the numbers as reported by the company. Note: Round answers to one decimal place (ex: 0.2345 = 23.5%). 2018 26% 15.2% 73.8% Metric RNOA ROA 26.796 15.8% 75.3% ROE b. Adjust equity and total assets for the amount of treasury stock S millions 2019 2018 2017 Assets, restated $ 0 X5 0 X 5 OX Equity, restated OXS 0 X 5 OX
Step by Step Solution
There are 3 Steps involved in it

Get step-by-step solutions from verified subject matter experts