

Question: Part B Describe the scatterplot. To support description, calculate and interpret Pearson's r for this two variables. Calculate without computer Part D Calculate the regression
Part B
Describe the scatterplot. To support description, calculate and interpret Pearson's r for this two variables. Calculate without computer
Part D
Calculate the regression equation for a least squares regression of literacy rate as a function of poverty rate. Show your work for calculations no computer
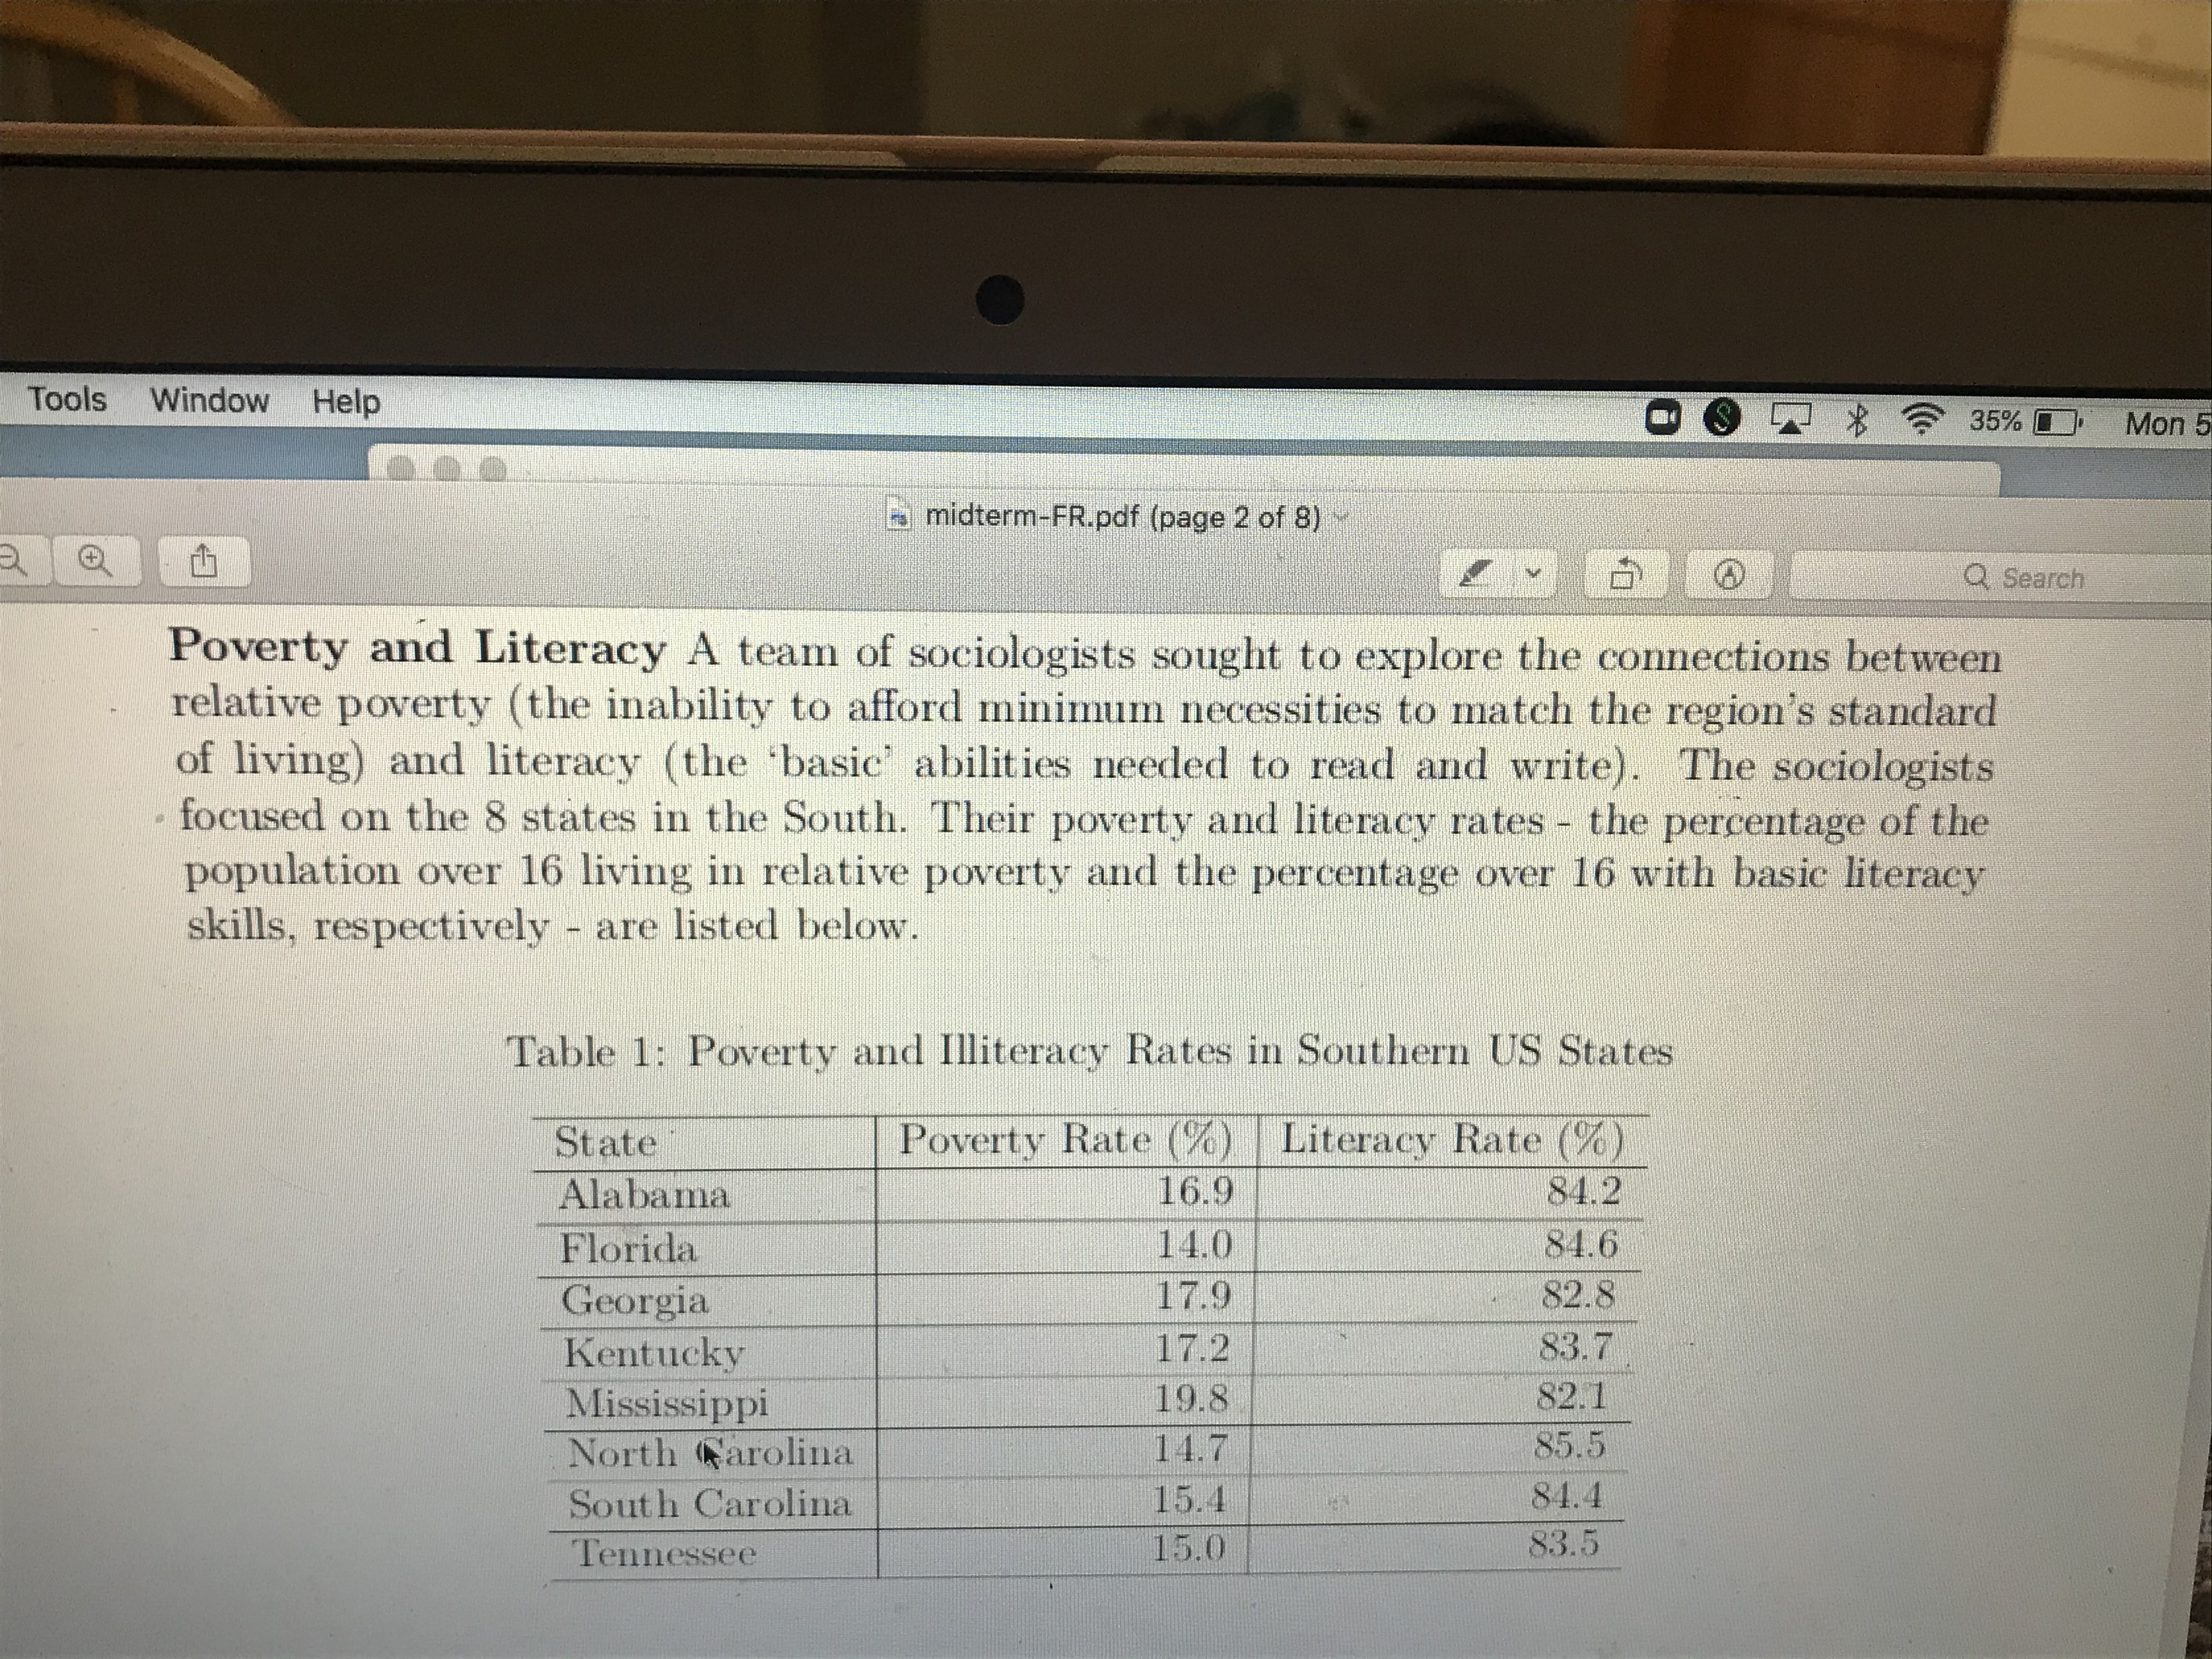
Tools Window Help 35% Mon midterm-FR.pdf (page 2 of 8) Q Search Poverty and Literacy A team of sociologists sought to explore the connections between relative poverty (the inability to afford minimum necessities to match the region's standard of living) and literacy (the 'basic' abilities needed to read and write). The sociologists focused on the 8 states in the South. Their poverty and literacy rates - the percentage of the population over 16 living in relative poverty and the percentage over 16 with basic literacy skills, respectively - are listed below. Table 1: Poverty and Illiteracy Rates in Southern US States State Poverty Rate (%) Literacy Rate ("%) Alabama 16.9 84.2 Florida 14.0 84.6 Georgia 17.9 82.8 Kentucky 17.2 83.7 Mississippi 19.8 82.1 North Carolina 14.7 85.5 South Carolina 15.4 84.4 Tennessee 15.0 83.5
Step by Step Solution
There are 3 Steps involved in it

Get step-by-step solutions from verified subject matter experts