

Question: Part B) Does the pattern for the vaccinated vs. non-vaccinated comparisons and 95% CI support a relationship between vaccination and autism? The study provides evidence
Part B) Does the pattern for the vaccinated vs. non-vaccinated comparisons and 95% CI support a relationship between vaccination and autism?
The study provides evidence against the association of autism with either MMR or single measles vaccine.
Compare all different confidence intervals, are three of them significant and compare etc.
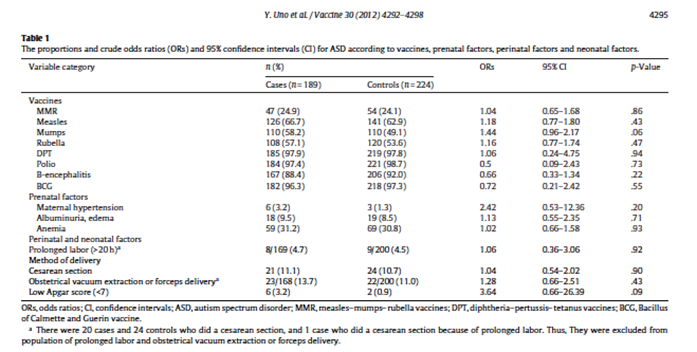
Y. Uno et al / Vaccine 30 (2012) 4292-4798 4795 Table 1 The proportions and crude odds ratios (ORs) and 95% confidence intervals (C) for ASD according to vaccines, prenatal factors, perinatal factors and neonatal factors. Variable category ORs 951 0 P-Value Cases (1 = 189) Controls (n = 224) Vaccines MMR 47 (249) 54 (241) 1.04 0.65-1.68 86 Measles 126 (65.7) 141 (62.9) 1.18 0.77-1.80 43 Mumps 110 (58.2) 110 (49.1) 1.44 0.96-2.17 106 Rubella 108 (57.1) 120 (53.6) 1.16 0.77-1.74 47 DPT 185 (97.9) 219 (97.8) 1.06 0.24-4.75 94 Polio 184 (97.4) 221 (98.7) 0.5 0.09-2.43 73 B-encephalitis 167 (85.4) 206 (92 0) 0.56 0.33-1.34 22 BOG 182 (96.3) 218 (97.3) 0.72 0.21-2.42 55 Prenatal factors Maternal hypertension 6(32) 2.42 0.53-12.36 20 Albuminuria, edema 18 (9.5) 19 (8.5) 1.13 0.55-2.35 71 Anemia 59 (31.2) 69 (30.8) 1.02 0.65-1.58 93 Perinatal and neonatal factors Prolonged labor () 20h) 4/169 (4.7) 200 (4.5) 1.06 0.36-3.06 92 Method of delivery Cesarean section 21 (1 1.1) 24 (107) 1.04 0.54-2.02 90 Obstetrical vacuum extraction or forceps delivery 23/168 (13.7) 22/200 (1 1.0) 1.28 0.66-251 .43 Low Apgar score (
Step by Step Solution
There are 3 Steps involved in it

Get step-by-step solutions from verified subject matter experts