

Question: Part B Everon also has information extract from financial statement of last three years as table below ('000.000 VND). Analyze the profitability and liquidity of
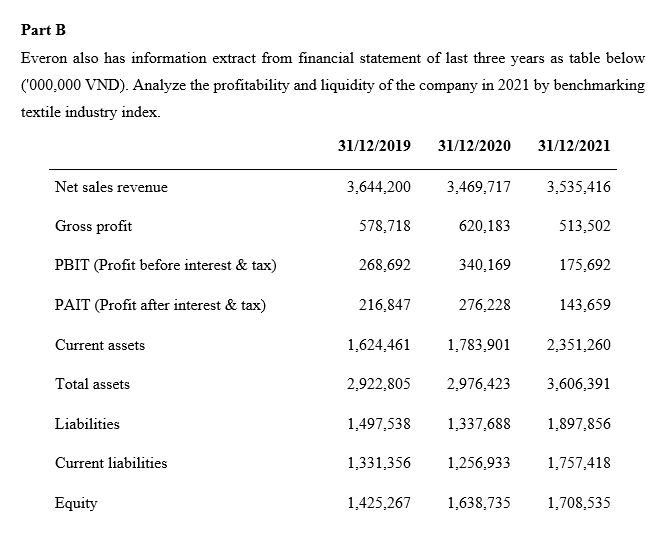
Part B Everon also has information extract from financial statement of last three years as table below ('000.000 VND). Analyze the profitability and liquidity of the company in 2021 by benchmarking textile industry index. 31/12/2019 31/12/2020 31/12/2021 Net sales revenue 3,644,200 3,469,717 3,535,416 Gross profit 578,718 620,183 513,502 PBIT (Profit before interest & tax) 268,692 340.169 175,692 PAIT (Profit after interest & tax) 216,847 276,228 143,659 Current assets 1,624.461 1,783,901 2,351,260 Total assets 2,922,805 2.976,423 3,606,391 Liabilities 1,497,538 1,337,688 1,897,856 Current liabilities 1,331,356 1.256,933 1.757.418 Equity 1.425,267 1,638,735 1,708,535 Part B Everon also has information extract from financial statement of last three years as table below ('000.000 VND). Analyze the profitability and liquidity of the company in 2021 by benchmarking textile industry index. 31/12/2019 31/12/2020 31/12/2021 Net sales revenue 3,644,200 3,469,717 3,535,416 Gross profit 578,718 620,183 513,502 PBIT (Profit before interest & tax) 268,692 340.169 175,692 PAIT (Profit after interest & tax) 216,847 276,228 143,659 Current assets 1,624.461 1,783,901 2,351,260 Total assets 2,922,805 2.976,423 3,606,391 Liabilities 1,497,538 1,337,688 1,897,856 Current liabilities 1,331,356 1.256,933 1.757.418 Equity 1.425,267 1,638,735 1,708,535
Step by Step Solution
There are 3 Steps involved in it

Get step-by-step solutions from verified subject matter experts