

Question: Part B ew History Bookmarks Profiles Window Help Do Homework - Section 4.1 Homework mathxl.com/Student/PlayerHomework.aspx?homeworkid=607248133&questionld=7&flushed=true&cld=6654315¢erwin=yes Search MATH128-W41-Fall 2021-Stevens-JJC alexa carlon |10/26/219:07 PM Homework: Sec... Question
Part B
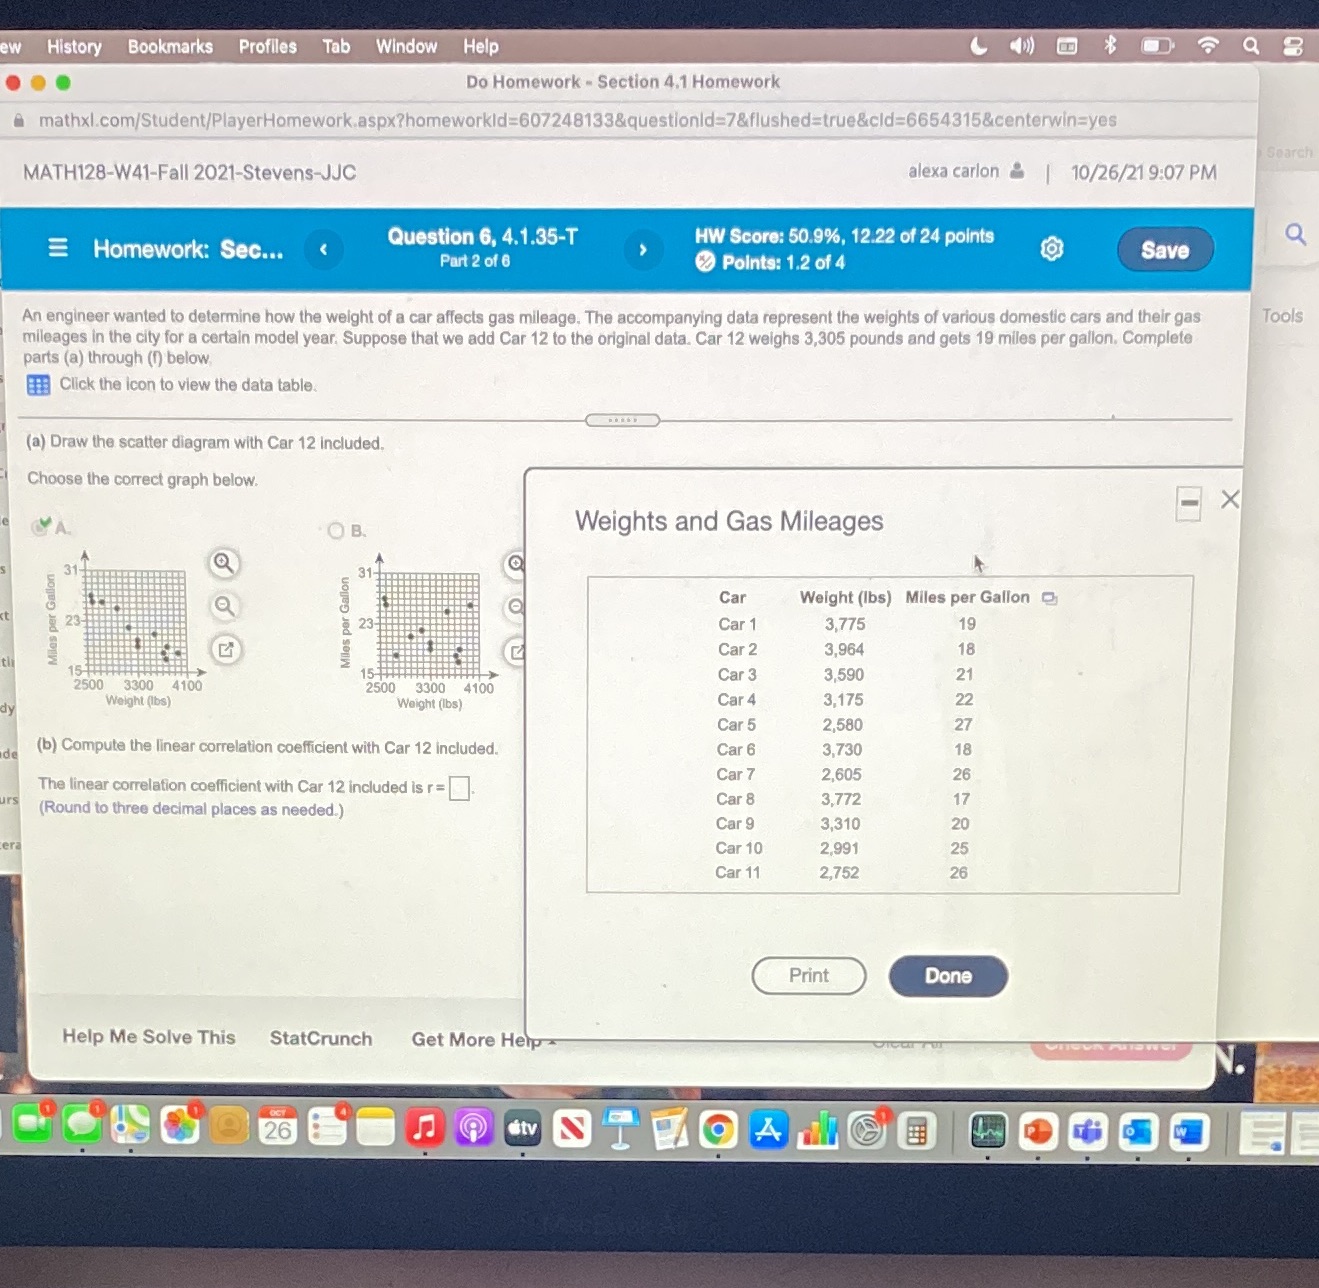
ew History Bookmarks Profiles Window Help Do Homework - Section 4.1 Homework mathxl.com/Student/PlayerHomework.aspx?homeworkid=607248133&questionld=7&flushed=true&cld=6654315¢erwin=yes Search MATH128-W41-Fall 2021-Stevens-JJC alexa carlon |10/26/219:07 PM Homework: Sec... Question 6, 4.1.35-T HW Score: 50.9%, 12.22 of 24 points Q Part 2 of 6 Points: 1.2 of 4 Save An engineer wanted to determine how the weight of a car affects gas mileage. The accompanying data represent the weights of various domestic cars and their gas Tools mileages in the city for a certain model year. Suppose that we add Car 12 to the original data. Car 12 weighs 3,305 pounds and gets 19 miles per gallon. Complete parts (a) through (1) below Click the icon to view the data table. (a) Draw the scatter diagram with Car 12 included. Choose the correct graph below. -X O B. Weights and Gas Mileages a Car Weight (Ibs) Miles per Gallon 23 Car 1 3,775 19 Car 2 3,964 18 Car 3 3,590 21 2500 3300 3300 4100 Weight (Ibs) Weight (Ibs) Car 4 3,175 22 Car 5 2,580 27 (b) Compute the linear correlation coefficient with Car 12 included. Car 6 3,730 18 Car 7 2,605 26 The linear correlation coefficient with Car 12 included is r = Car 8 3,772 17 (Round to three decimal places as needed.) Car 9 3,310 20 Car 10 2,991 25 Car 11 2.752 26 Print Done Help Me Solve This StatCrunch Get More Help
Step by Step Solution
There are 3 Steps involved in it

Get step-by-step solutions from verified subject matter experts