

Question: PART B. For each problem, briefly explain why you choose your answer. Variable Count Minimum Q1 Median Q3 Maximum Incomes 200 3.67 17.6 21.6 27.34
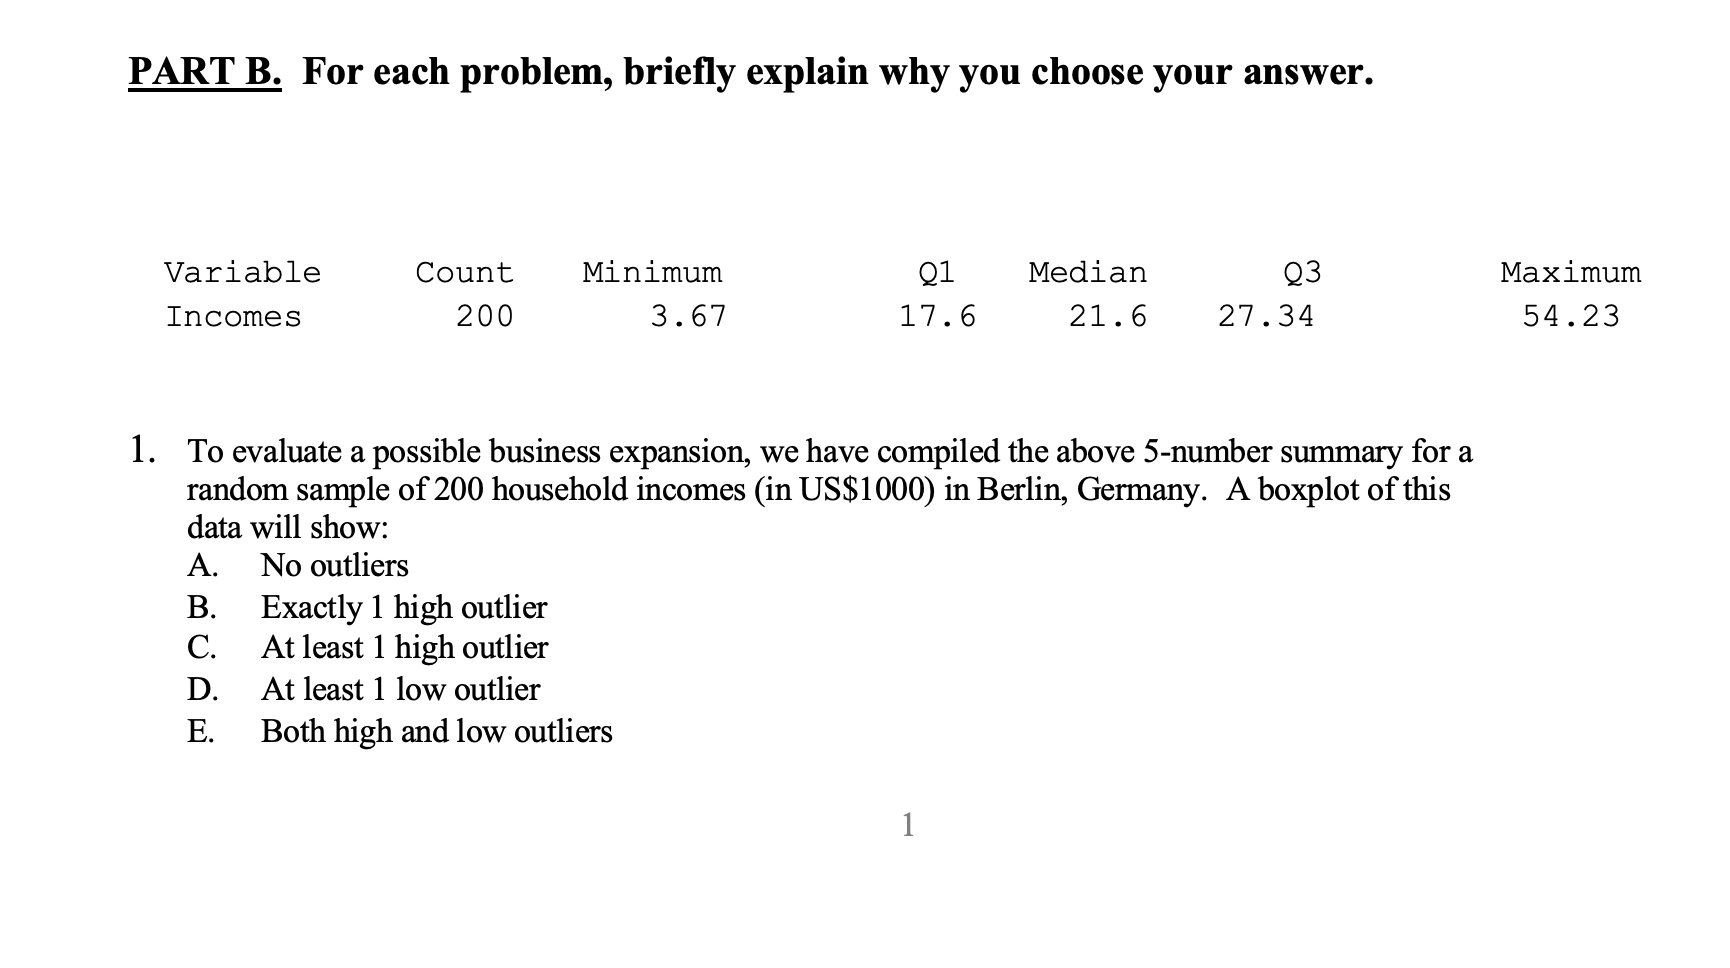
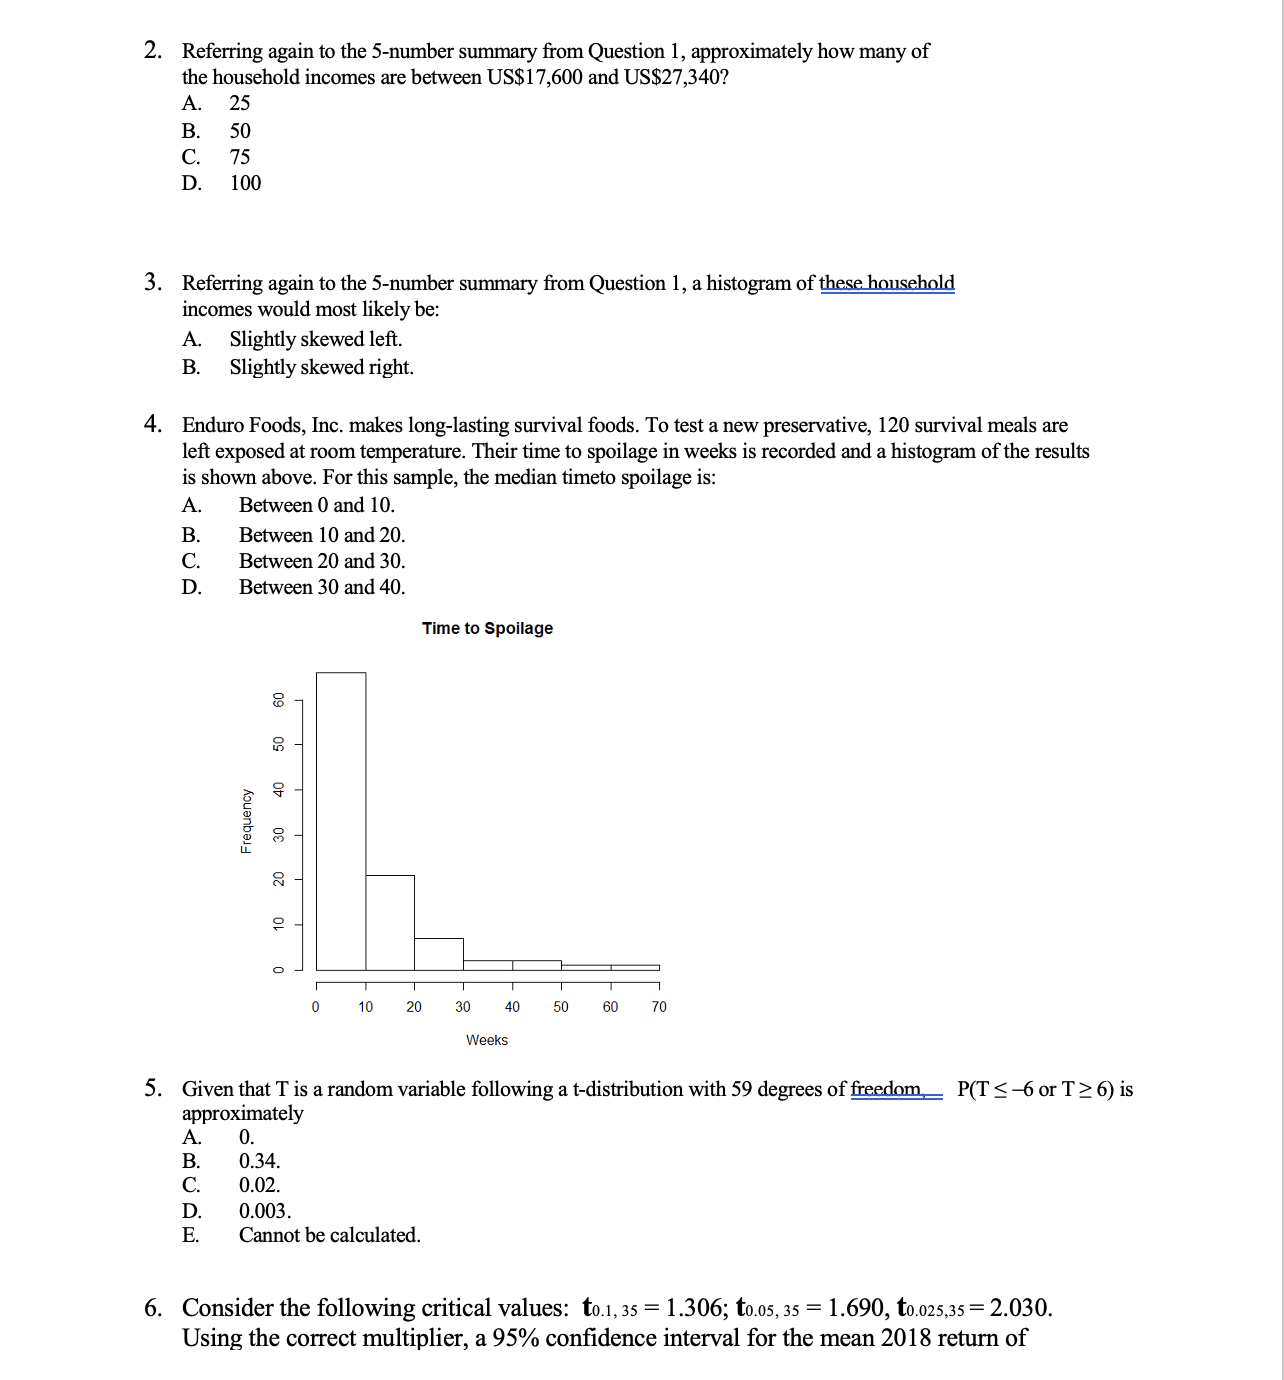
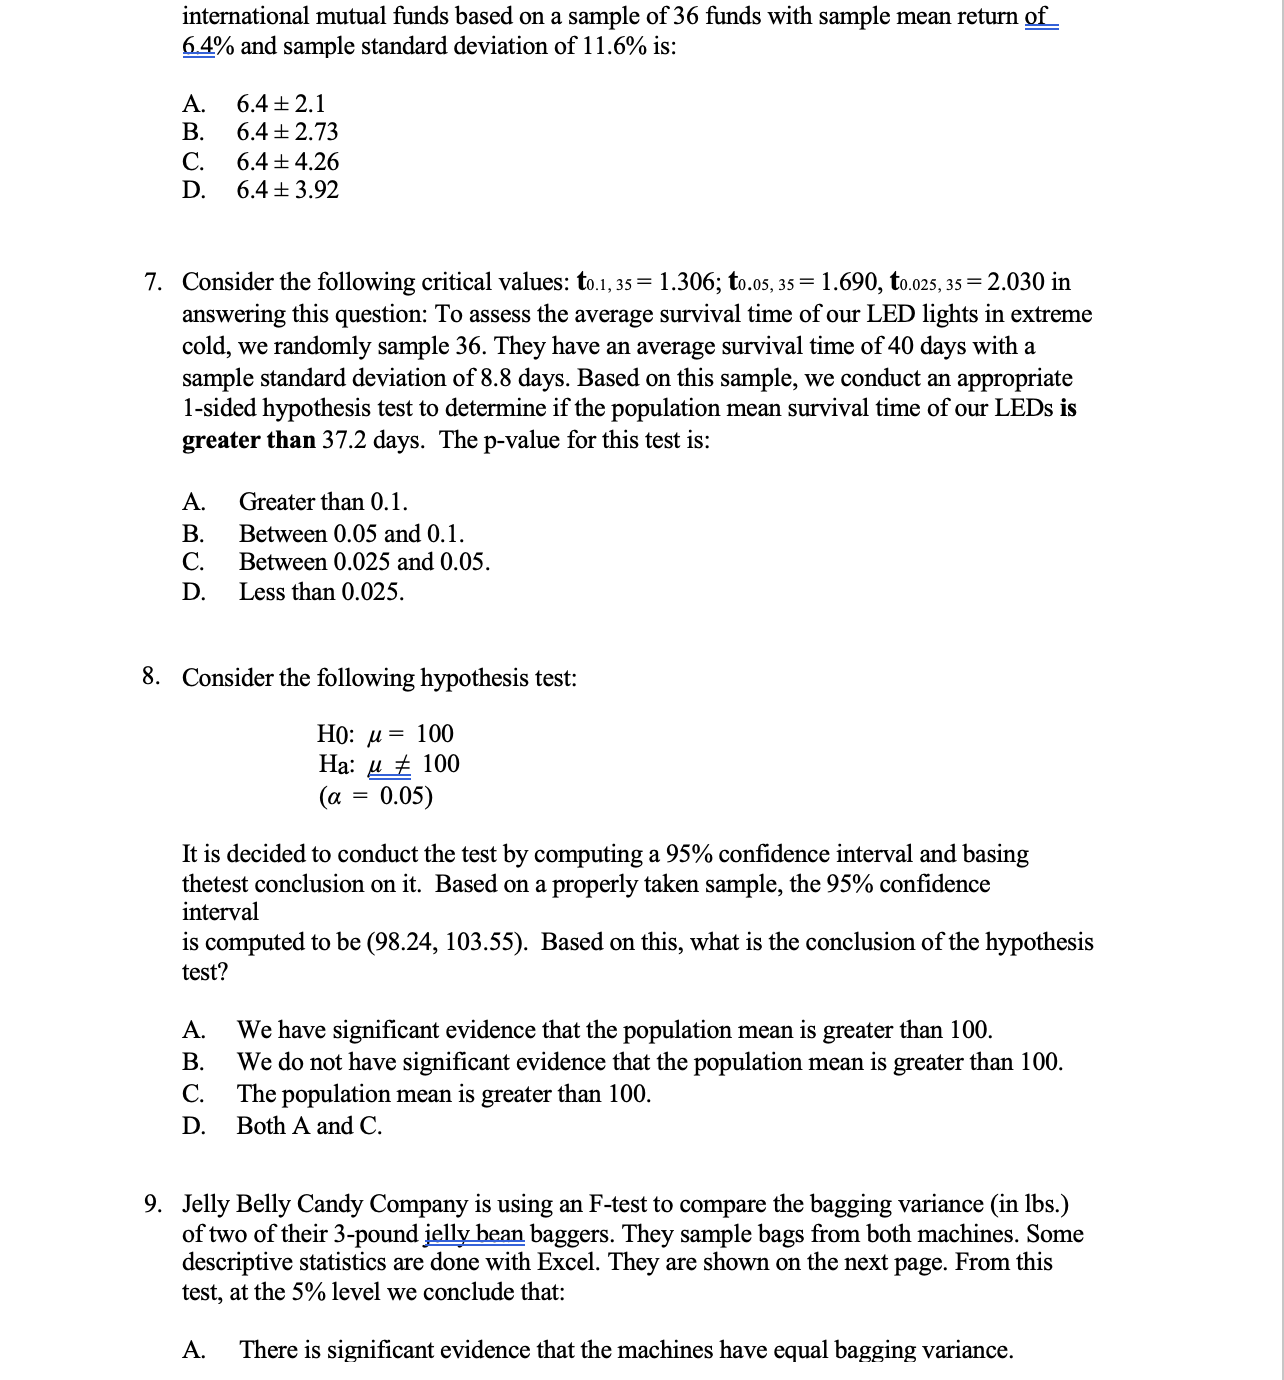
PART B. For each problem, briefly explain why you choose your answer. Variable Count Minimum Q1 Median Q3 Maximum Incomes 200 3.67 17.6 21.6 27.34 54.23 1. To evaluate a possible business expansion, we have compiled the above 5-number summary for a random sample of 200 household incomes (in US$1000) in Berlin, Germany. A boxplot of this data will show: No outliers Exactly 1 high outlier At least 1 high outlier At least 1 low outlier Both high and low outliers Mo Ow > 2. Referring again to the 5-number summary from Question 1, approximately how many of the household incomes are between US$17,600 and US$27,340? A 25 B. 50 cC. 75 D. 100 3. Referring again to the 5-number summary from Question 1, a histogram of these household incomes would most likely be: A, Slightly skewed left. B. Slightly skewed right. 4. Enduro Foods, Inc. makes long-lasting survival foods. To test a new preservative, 120 survival meals are left exposed at room temperature. Their time to spoilage in weeks is recorded and a histogram of the results is shown above. For this sample, the median timeto spoilage is: A Between 0 and 10. B. Between 10 and 20. C. Between 20 and 30. D. Between 30 and 40. Time to Spoilage 40 50 80 Frequency 20 20 10 Weeks 5. Given that T is a random variable following a t-distribution with 59 degrees of fieedom, . P(T6) is approximately A0 B. 0.34. C, 0.02. D. 0.003. E. Cannot be calculated. 6. Consider the following critical values: to.1,35 = 1.306; to.0s,35 = 1.690, t0.025,35 = 2.030. Using the correct multiplier, a 95% confidence interval for the mean 2018 return of international mutual funds based on a sample of 36 funds with sample mean return of 6.4% and sample standard deviation of 11.6% is: A 64+21 B. 64+273 C. 64+4.26 D. 64+392 . Consider the following critical values: to.1,35 = 1.306; to.0s, 35 = 1.690, t0.025,35=2.030 in answering this question: To assess the average survival time of our LED lights in extreme cold, we randomly sample 36. They have an average survival time of 40 days with a sample standard deviation of 8.8 days. Based on this sample, we conduct an appropriate 1-sided hypothesis test to determine if the population mean survival time of our LEDs is greater than 37.2 days. The p-value for this test is: A. Greater than 0.1. B. Between 0.05 and 0.1. C. Between 0.025 and 0.05. D. Lessthan 0.025. Consider the following hypothesis test: HO: = 100 Ha: g # 100 (a = 0.05) It is decided to conduct the test by computing a 95% confidence interval and basing thetest conclusion on it. Based on a properly taken sample, the 95% confidence interval is computed to be (98.24, 103.55). Based on this, what is the conclusion of the hypothesis test? We have significant evidence that the population mean is greater than 100. We do not have significant evidence that the population mean is greater than 100. The population mean is greater than 100. Both A and C. COwp . Jelly Belly Candy Company is using an F-test to compare the bagging variance (in 1bs.) of two of their 3-pound jelly hean baggers. They sample bags from both machines. Some descriptive statistics are done with Excel. They are shown on the next page. From this test, at the 5% level we conclude that: A. There is significant evidence that the machines have equal bagging variance. A. There is significant evidence that the machines have equal bagging variance. 3 B. There is significant evidence that Machine 1 has greater bagging variance than Machine 2. C There is significant evidence that Machine 2 has greater bagging variance thanMachine 1. Machine 1 Machine 2 Mean 3.3284 Mean 3.278182 Mean Standard E 0.044222 Standard E: 0.016378 Standard Error Median 3.28 Median 3.295 Median Mode 3.2 Mode 3.3 Mode Standard D 0.221109 Standard D 0.07682 Standard Deviation Sample Var 0.048889 Sample Var 0.005901 Sample Variance Kurtosis 1.037357 Kurtosis 2.451911 Kurtosis Skewness 0.846079 Skewness -1.37683 Skewness F.INV(0.95, 24, 21) = 2.054 Range 0.95 Range 0.33 Range Minimum 2.95 Minimum 3.05 Minimum Maximum 3.9 Maximum 3.38 Maximum Sum 83.21 Sum 72.12 Sum Count 25 Count 22 Count
Step by Step Solution
There are 3 Steps involved in it

Get step-by-step solutions from verified subject matter experts