

Question: Part b ) In the same script as above, begin a new code cell for Part b . Using an array t of the appropriate
Part b
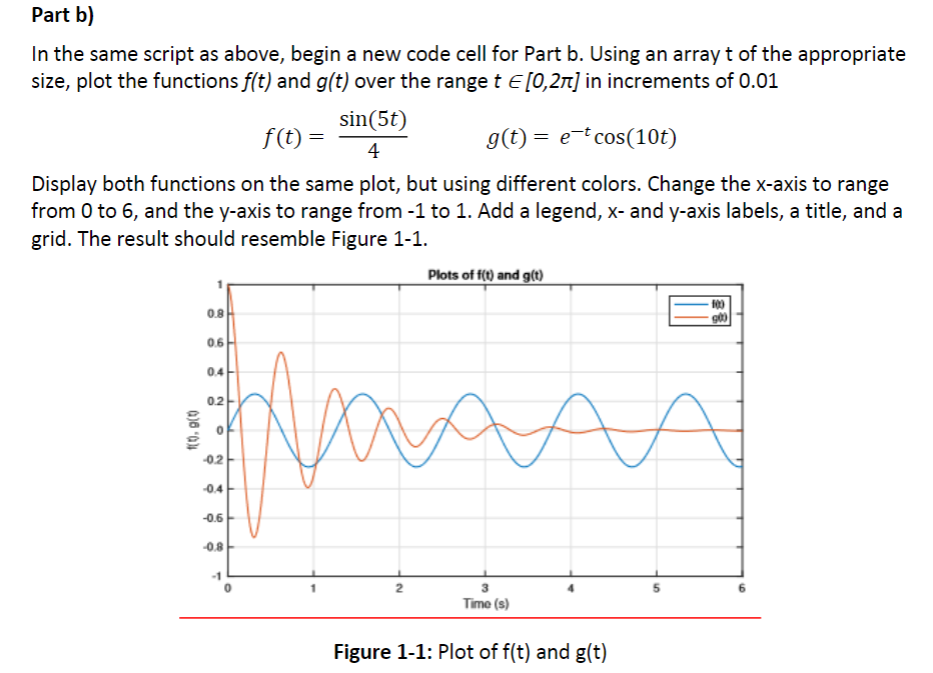
In the same script as above, begin a new code cell for Part b Using an array t of the appropriate
size, plot the functions and over the range tin in increments of
Display both functions on the same plot, but using different colors. Change the axis to range
from to and the axis to range from to Add a legend, and axis labels, a title, and a
grid. The result should resemble Figure
Plots of and
Figure : Plot of and
Step by Step Solution
There are 3 Steps involved in it
1 Expert Approved Answer
Step: 1 Unlock

Question Has Been Solved by an Expert!
Get step-by-step solutions from verified subject matter experts
Step: 2 Unlock
Step: 3 Unlock