

Question: Part ( b ) Plot a graph of the payoff and the profit of the above position as a function of XYZ stock price at
Part b
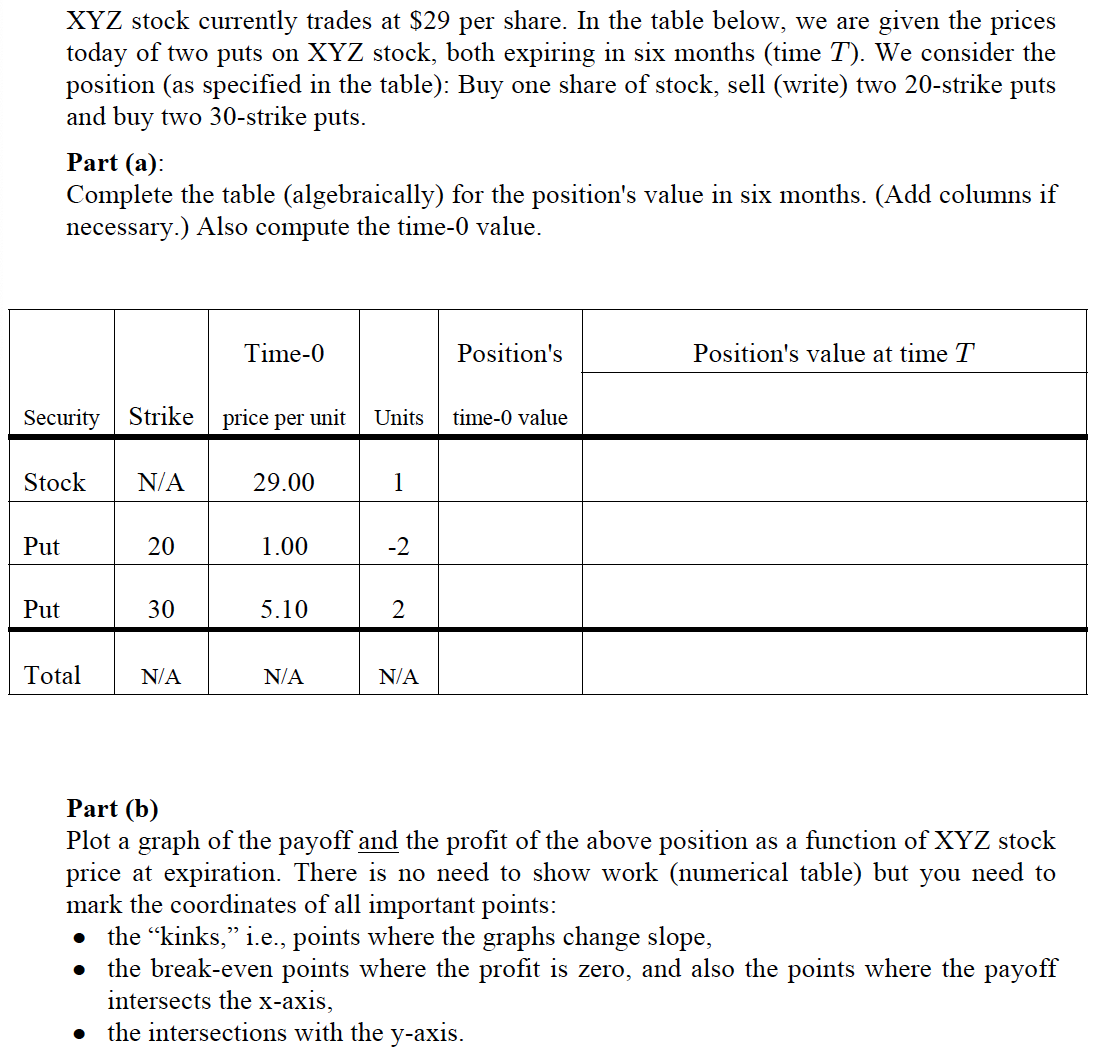
Plot a graph of the payoff and the profit of the above position as a function of XYZ stock
price at expiration. There is no need to show work numerical table but you need to
mark the coordinates of all important points:
the "kinks," ie points where the graphs change slope,
the breakeven points where the profit is zero, and also the points where the payoff
intersects the axis,
the intersections with the axis.
Step by Step Solution
There are 3 Steps involved in it
1 Expert Approved Answer
Step: 1 Unlock

Question Has Been Solved by an Expert!
Get step-by-step solutions from verified subject matter experts
Step: 2 Unlock
Step: 3 Unlock