

Question: Part B - Problem Solving The following data shows the number of texts/posts that people have sent in an hour. 20 76 22 52 50
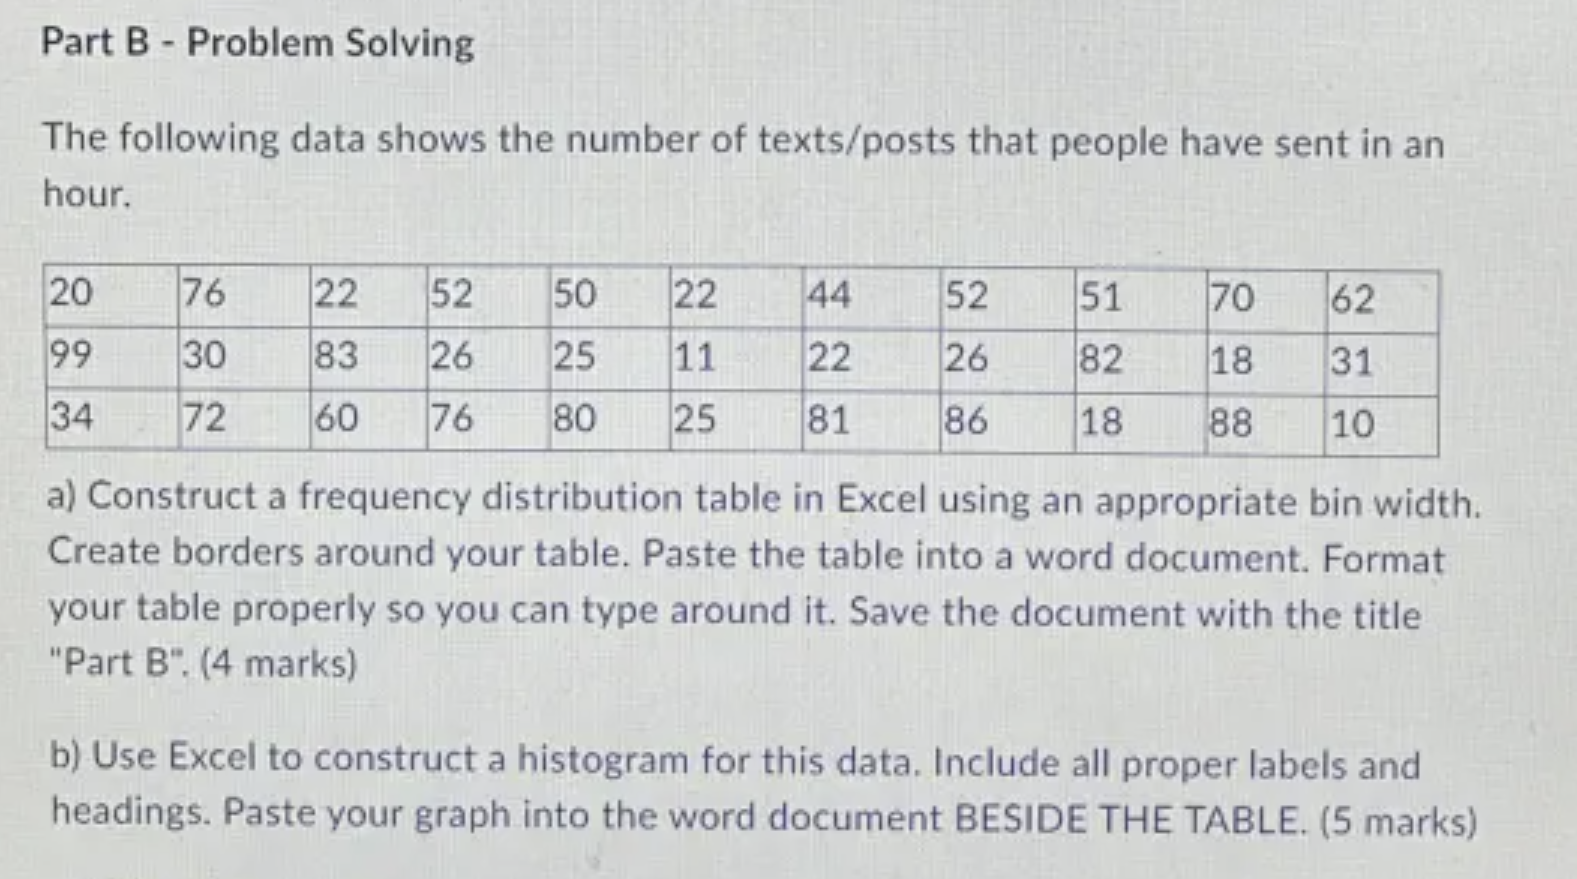
Part B - Problem Solving The following data shows the number of texts/posts that people have sent in an hour. 20 76 22 52 50 22 44 52 51 70 62 99 30 83 26 25 11 22 26 82 18 31 34 72 60 76 80 25 81 86 18 88 10 a) Construct a frequency distribution table in Excel using an appropriate bin width. Create borders around your table. Paste the table into a word document. Format your table properly so you can type around it. Save the document with the title "Part B". (4 marks) b) Use Excel to construct a histogram for this data. Include all proper labels and headings. Paste your graph into the word document BESIDE THE TABLE
Step by Step Solution
There are 3 Steps involved in it
1 Expert Approved Answer
Step: 1 Unlock

Question Has Been Solved by an Expert!
Get step-by-step solutions from verified subject matter experts
Step: 2 Unlock
Step: 3 Unlock