

Question: Part B. Process Capability Analysis without Using Control Chart (4 Marks) 7) It is calculated that the sample standard deviation of the 60 measured beam
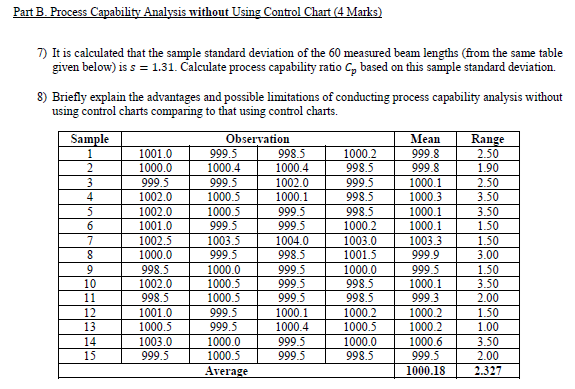
Part B. Process Capability Analysis without Using Control Chart (4 Marks) 7) It is calculated that the sample standard deviation of the 60 measured beam lengths (from the same table given below) is s=1.31. Calculate process capability ratio Cp based on this sample standard deviation. 8) Briefly explain the advantages and possible limitations of conducting process capability analysis without using control charts combaring to that using control charts
Step by Step Solution
There are 3 Steps involved in it
1 Expert Approved Answer
Step: 1 Unlock

Question Has Been Solved by an Expert!
Get step-by-step solutions from verified subject matter experts
Step: 2 Unlock
Step: 3 Unlock