

Question: Part B: Scenario Analysis 1. Contraction . Assume increased competition and a depressed economy limits sales growth to 7% in 2015. In addition, rising interest
Part B: Scenario Analysis
1. Contraction. Assume increased competition and a depressed economy limits sales growth to 7% in 2015. In addition, rising interest rates push the rate on short-term debt to 9.5%. Also, rising costs lower gross margins, pushing COGS/Sales to 68.5%.
Q3: Under the contraction scenario, what level of long-term debt will be required in 2015? _________________
Q4: What is projected net income? _________________
2. High growth. Unexpected demand pushes sales growth to 30% in 2015. Because some costs are fixed, SG&A/Sales drops to 7.5%. Also, much of the sales growth is supported by existing excess capacity, so PPE/Sales is projected to be only 425%. COGS/Sales returns to its initial level (average of previous 3 years). The interest rate on short-term debt returns to its initial level.
Q5: Under the high-growth scenario, what level of long-term debt will be required in 2015? _________________
Q6: What is projected net income? _________________
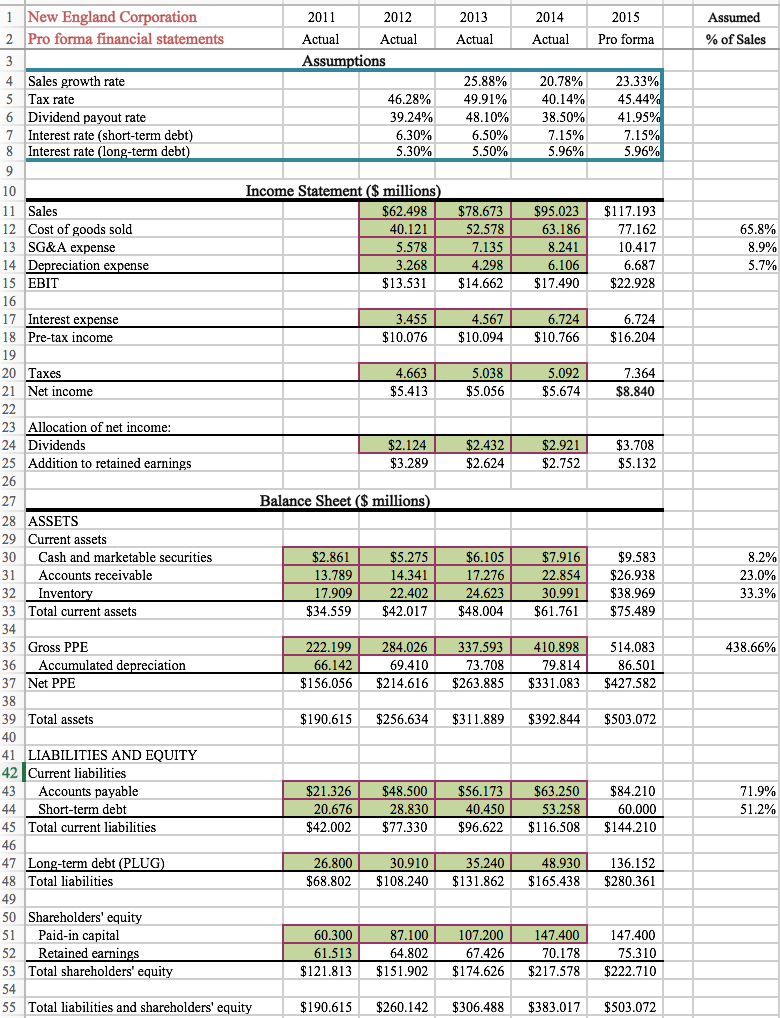
2013 Actual 2014 Actual 2015 Pro forma Assumed % of Sales 25.88% 49.91% 48.10% 6.50% 5.50% 20.78% 40.14% 38.50% 7.15% 5.96% 23.33% 45.44% 41.95% 7.15% 5.96% $78.673 52.578 7.135 4.298 $14.662 $95.023 63.186 8.241 $117.193 77.162 10.417 6.687 $22.928 65.8% 8.9% 5.7% 6.106 $17.490 4.567 $10.094 6.724 $10.766 6.724 $16.204 5.038 $5.056 5.092 $5.674 7.364 $8.840 $2.432 $2.624 $2.921 $2.752 $3.708 $5.132 1 New England Corporation 2011 2012 2 Pro forma financial statements Actual Actual 3 Assumptions Sales growth rate S Tax rate 46.28% 6 Dividend payout rate 39.24% 7 Interest rate (short-term debt) 6.30% 8 Interest rate (long-term debt) 5.30% 9 10 Income Statement ($ millions) 11 Sales $62.498 12 Cost of goods sold 40.121 13 SG&A expense 5.578 14 Depreciation expense 3.268 15 EBIT $13.531 16 17 Interest expense 3.455 18 Pre-tax income $10.076 19 20 Taxes 4.663 21 Net income $5.413 22 23 Allocation of net income: 24 Dividends $2.124 25 Addition to retained earnings $3.289 26 27 Balance Sheet ($ millions 28 ASSETS 29 Current assets 30 Cash and marketable securities $2.861 $5.275 31 Accounts receivable 13.789 14.341 32 Inventory 17.909 22.402 33 Total current assets $34.559 $42.017 34 35 Gross PPE 222.199 284.026 36 Accumulated depreciation 66.142 69.410 37 Net PPE $156.056 $214.616 38 39 Total assets $190.615 $256.634 40 41 LIABILITIES AND EQUITY 42 Current liabilities 43 Accounts payable $21.326 $48.500 44 Short-term debt 20.676 28.830 45 Total current liabilities $42.002 $77.330 46 47 Long-term debt (PLUG) 26.800 30.910 48 Total liabilities $68.802 $108.240 49 50 Shareholders' equity 51 Paid-in capital 60.300 87.100 52 Retained earnings 61.513 64.802 53 Total shareholders' equity $121.813 $151.902 54 55 Total liabilities and shareholders' equity $190.615 $260.142 $6.105 17.276 24.623 $48.004 $7.916 22.854 30.991 $61.761 $9.583 $26.938 $38.969 $75.489 8.2% 23.0% 33.3% 438.66% 337.593 73.708 $263.885 410.898 79.814 $331.083 514.083 86.501 $427.582 $311.889 $392.844 $503.072 $56.173 40.450 $96.622 $63.250 53.258 $116.508 $84.210 60.000 $144.210 71.9% 51.2% 35.240 $131.862 48.930 $165.438 136.152 $280.361 107.200 67.426 $174.626 147.400 70.178 $217.578 147.400 75.310 $222.710 $306.488 $383.017 $503.072 2013 Actual 2014 Actual 2015 Pro forma Assumed % of Sales 25.88% 49.91% 48.10% 6.50% 5.50% 20.78% 40.14% 38.50% 7.15% 5.96% 23.33% 45.44% 41.95% 7.15% 5.96% $78.673 52.578 7.135 4.298 $14.662 $95.023 63.186 8.241 $117.193 77.162 10.417 6.687 $22.928 65.8% 8.9% 5.7% 6.106 $17.490 4.567 $10.094 6.724 $10.766 6.724 $16.204 5.038 $5.056 5.092 $5.674 7.364 $8.840 $2.432 $2.624 $2.921 $2.752 $3.708 $5.132 1 New England Corporation 2011 2012 2 Pro forma financial statements Actual Actual 3 Assumptions Sales growth rate S Tax rate 46.28% 6 Dividend payout rate 39.24% 7 Interest rate (short-term debt) 6.30% 8 Interest rate (long-term debt) 5.30% 9 10 Income Statement ($ millions) 11 Sales $62.498 12 Cost of goods sold 40.121 13 SG&A expense 5.578 14 Depreciation expense 3.268 15 EBIT $13.531 16 17 Interest expense 3.455 18 Pre-tax income $10.076 19 20 Taxes 4.663 21 Net income $5.413 22 23 Allocation of net income: 24 Dividends $2.124 25 Addition to retained earnings $3.289 26 27 Balance Sheet ($ millions 28 ASSETS 29 Current assets 30 Cash and marketable securities $2.861 $5.275 31 Accounts receivable 13.789 14.341 32 Inventory 17.909 22.402 33 Total current assets $34.559 $42.017 34 35 Gross PPE 222.199 284.026 36 Accumulated depreciation 66.142 69.410 37 Net PPE $156.056 $214.616 38 39 Total assets $190.615 $256.634 40 41 LIABILITIES AND EQUITY 42 Current liabilities 43 Accounts payable $21.326 $48.500 44 Short-term debt 20.676 28.830 45 Total current liabilities $42.002 $77.330 46 47 Long-term debt (PLUG) 26.800 30.910 48 Total liabilities $68.802 $108.240 49 50 Shareholders' equity 51 Paid-in capital 60.300 87.100 52 Retained earnings 61.513 64.802 53 Total shareholders' equity $121.813 $151.902 54 55 Total liabilities and shareholders' equity $190.615 $260.142 $6.105 17.276 24.623 $48.004 $7.916 22.854 30.991 $61.761 $9.583 $26.938 $38.969 $75.489 8.2% 23.0% 33.3% 438.66% 337.593 73.708 $263.885 410.898 79.814 $331.083 514.083 86.501 $427.582 $311.889 $392.844 $503.072 $56.173 40.450 $96.622 $63.250 53.258 $116.508 $84.210 60.000 $144.210 71.9% 51.2% 35.240 $131.862 48.930 $165.438 136.152 $280.361 107.200 67.426 $174.626 147.400 70.178 $217.578 147.400 75.310 $222.710 $306.488 $383.017 $503.072
Step by Step Solution
There are 3 Steps involved in it

Get step-by-step solutions from verified subject matter experts