

Question: Part B: Short-answer question (25 marks) 1. 2. (8 marks) Figure 1 shows the evolution of GDP per-capita and the saving rate of Japan. Use
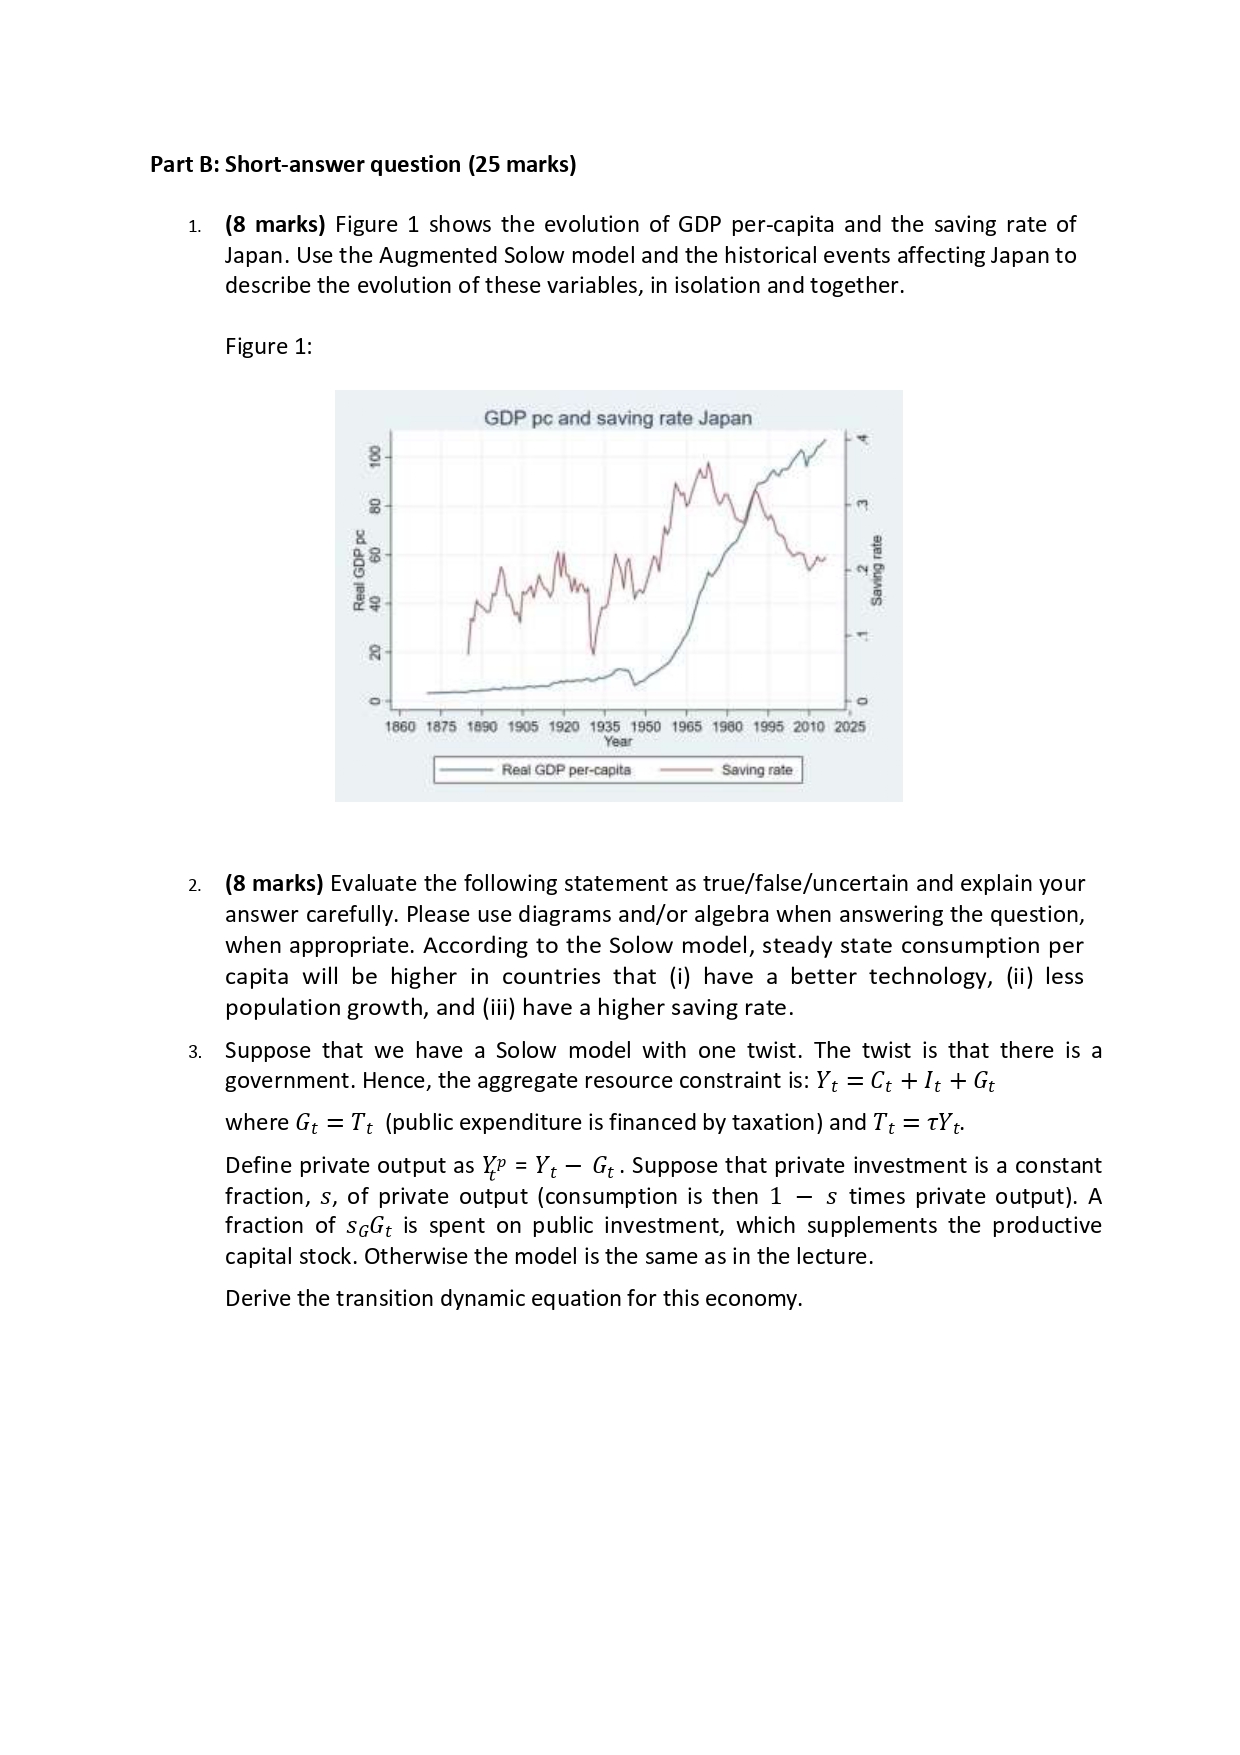

Part B: Short-answer question (25 marks) 1. 2. (8 marks) Figure 1 shows the evolution of GDP per-capita and the saving rate of Japan. Use the Augmented Solow model and the historical events affecting Japan to describe the evolution of these variables, in isolation and together. Figure 1: GDP pc and saying rate Japan if): 1 Real GDP pr_ bl.) 50 HE J- 4'.) 2 5a wig rare [1 - D I 1860 \"379 963'] '935 1925 1535 1550 196?: '980 98335 2WD 2925 YEJ!' Rea: (JDP per-caplta Saving rare (8 marks) Evaluate the following statement as true/false/uncertain and explain your answer carefully. Please use diagrams and/or algebra when answering the question, when appropriate. According to the Solow model, steady state consumption per capita will be higher in countries that (i) have a better technology, (ii) less population growth, and (iii) have a higher saving rate. Suppose that we have a Solow model with one twist. The twist is that there is a government. Hence, the aggregate resource constraint is: Y: = C: + It + G: where Gt = T: (public expenditure is financed by taxation) and T3 = TYt. Define private output as X? = YE Gt . Suppose that private investment is a constant fraction, 5, of private output (consumption is then 1 5 times private output). A fraction of .9th is spent on public investment, which supplements the productive capital stock. Otherwise the model is the same as in the lecture. Derive the transition dynamic equation for this economy
Step by Step Solution
There are 3 Steps involved in it

Get step-by-step solutions from verified subject matter experts