

Question: PART B (Structured Question) 1. The table below shows a set of hypothetical production possibilities for a nation. Combination Furniture ('000 units) Fruits ('000 kg)
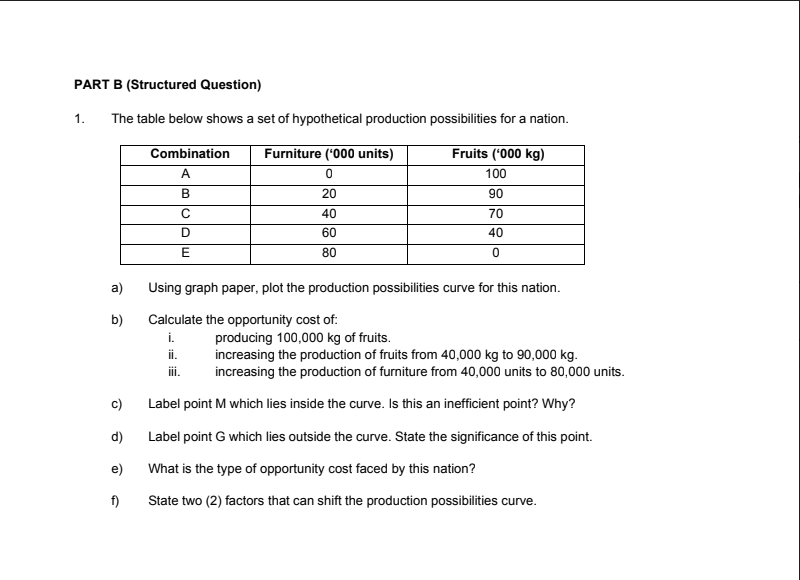

PART B (Structured Question) 1. The table below shows a set of hypothetical production possibilities for a nation. Combination Furniture ('000 units) Fruits ('000 kg) A 0 100 B 20 90 C 40 70 D 60 40 E 80 0 a) Using graph paper, plot the production possibilities curve for this nation. b) Calculate the opportunity cost of: producing 100,000 kg of fruits. increasing the production of fruits from 40,000 kg to 90,000 kg. iti. increasing the production of furniture from 40,000 units to 80,000 units. C) Label point M which lies inside the curve. Is this an inefficient point? Why? d) Label point G which lies outside the curve. State the significance of this point. e) What is the type of opportunity cost faced by this nation? f) State two (2) factors that can shift the production possibilities curve
Step by Step Solution
There are 3 Steps involved in it

Get step-by-step solutions from verified subject matter experts