

Question: Part B: System Description: Consider a flow line layout manufacturing shop, where manufactured parts pass through three consecutive machines namely: Drill, Tapping machine and Painting
Part B:
System Description:
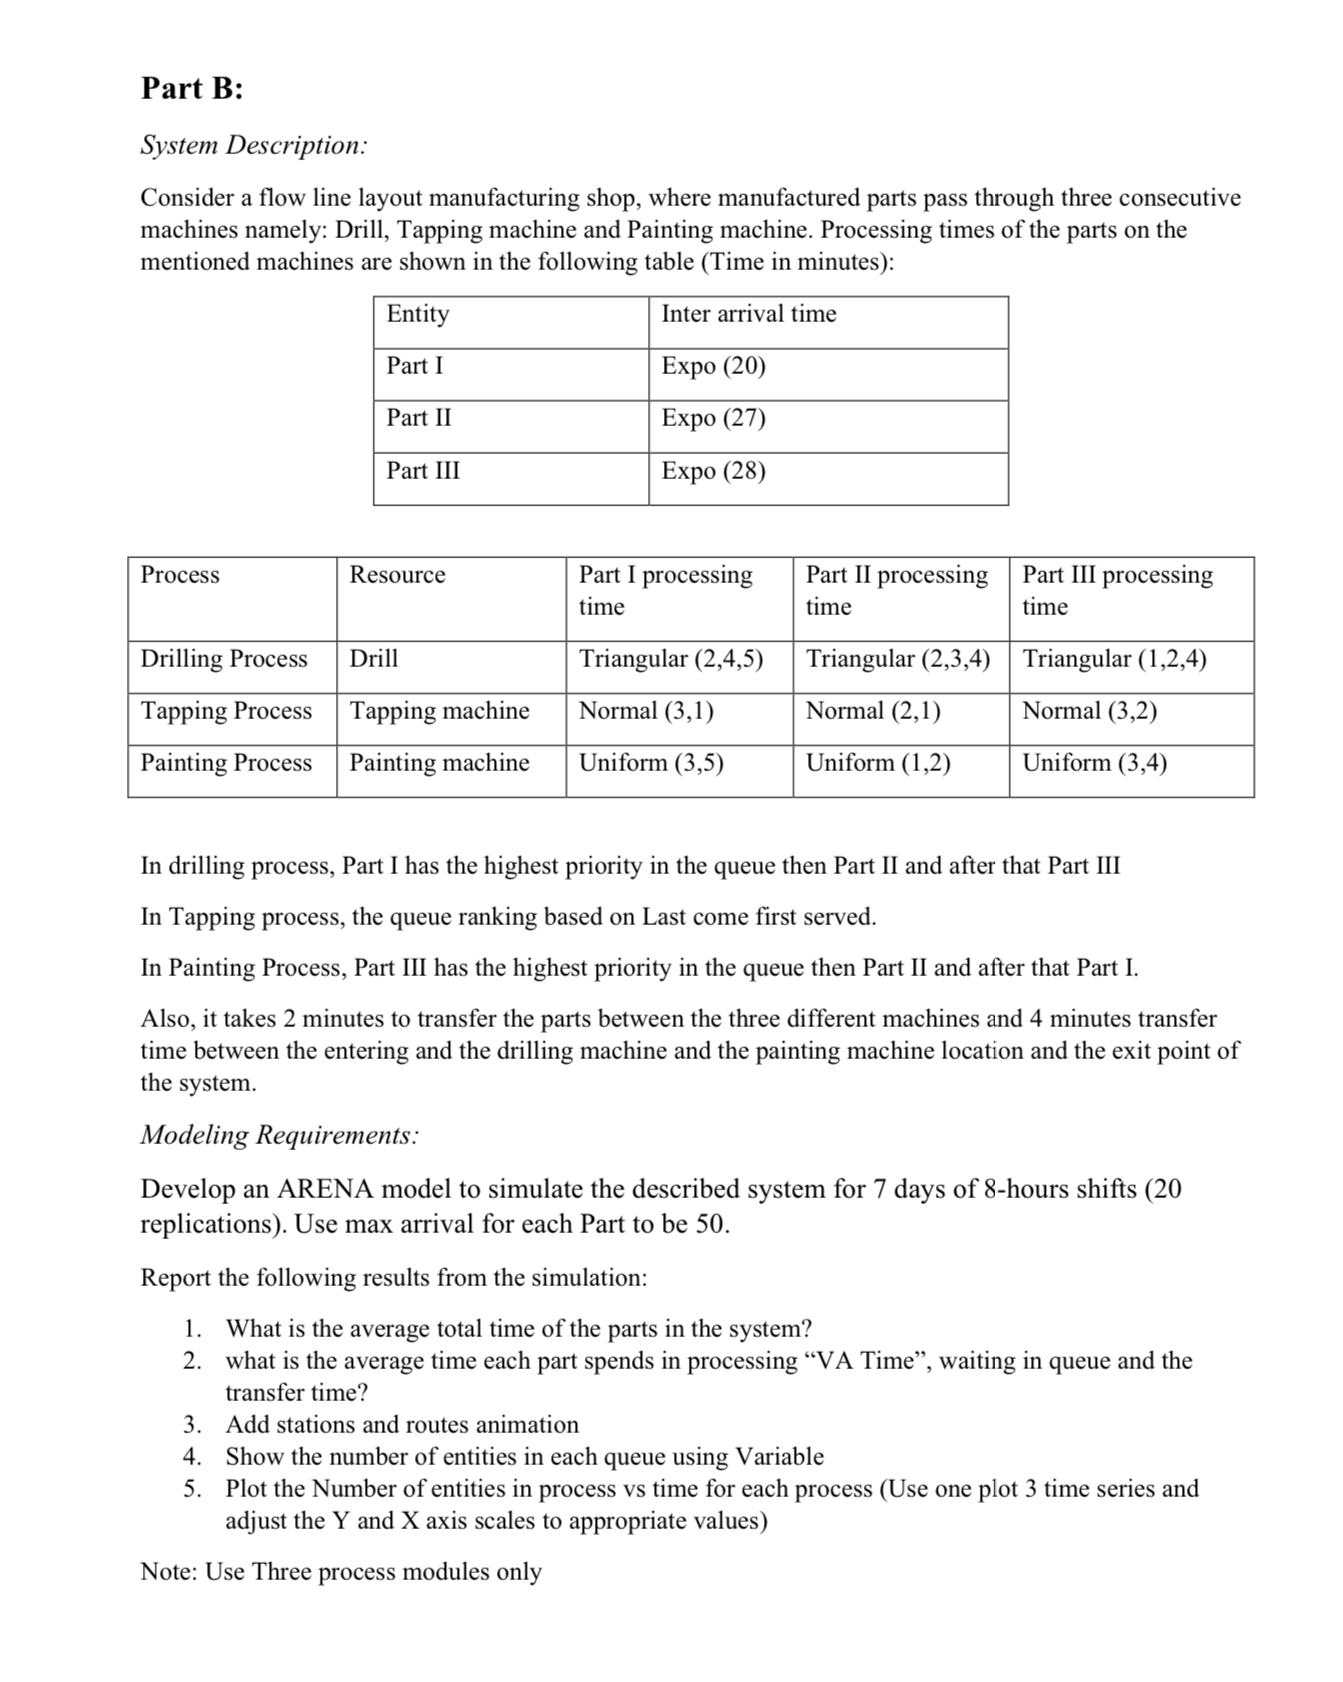
Consider a flow line layout manufacturing shop, where manufactured parts pass through three consecutive machines namely: Drill, Tapping machine and Painting machine. Processing times of the parts on the mentioned machines are shown in the following table Time in minutes:
tableEntityInter arrival timePart I,Expo Part IIExpo Part III,Expo
tableProcessResource,tablePart I processingtimetablePart II processingtimetablePart III processingtimeDrilling Process,Drill,Triangular Triangular Triangular Tapping Process,Tapping machine,Normal Normal Normal Painting Process,Painting machine,Uniform Uniform Uniform
In drilling process, Part I has the highest priority in the queue then Part II and after that Part III
In Tapping process, the queue ranking based on Last come first served.
In Painting Process, Part III has the highest priority in the queue then Part II and after that Part I.
Also, it takes minutes to transfer the parts between the three different machines and minutes transfer time between the entering and the drilling machine and the painting machine location and the exit point of the system.
Modeling Requirements:
Develop an ARENA model to simulate the described system for days of hours shifts replications Use max arrival for each Part to be
Report the following results from the simulation:
What is the average total time of the parts in the system?
what is the average time each part spends in processing VA Time", waiting in queue and the transfer time?
Add stations and routes animation
Show the number of entities in each queue using Variable
Plot the Number of entities in process vs time for each process Use one plot time series and adjust the Y and X axis scales to appropriate values
Note: Use Three process modules only
Step by Step Solution
There are 3 Steps involved in it
1 Expert Approved Answer
Step: 1 Unlock

Question Has Been Solved by an Expert!
Get step-by-step solutions from verified subject matter experts
Step: 2 Unlock
Step: 3 Unlock