

Question: PART B: The tables below represent data from a case control study of a bone density and its association with hip fracture. The data have
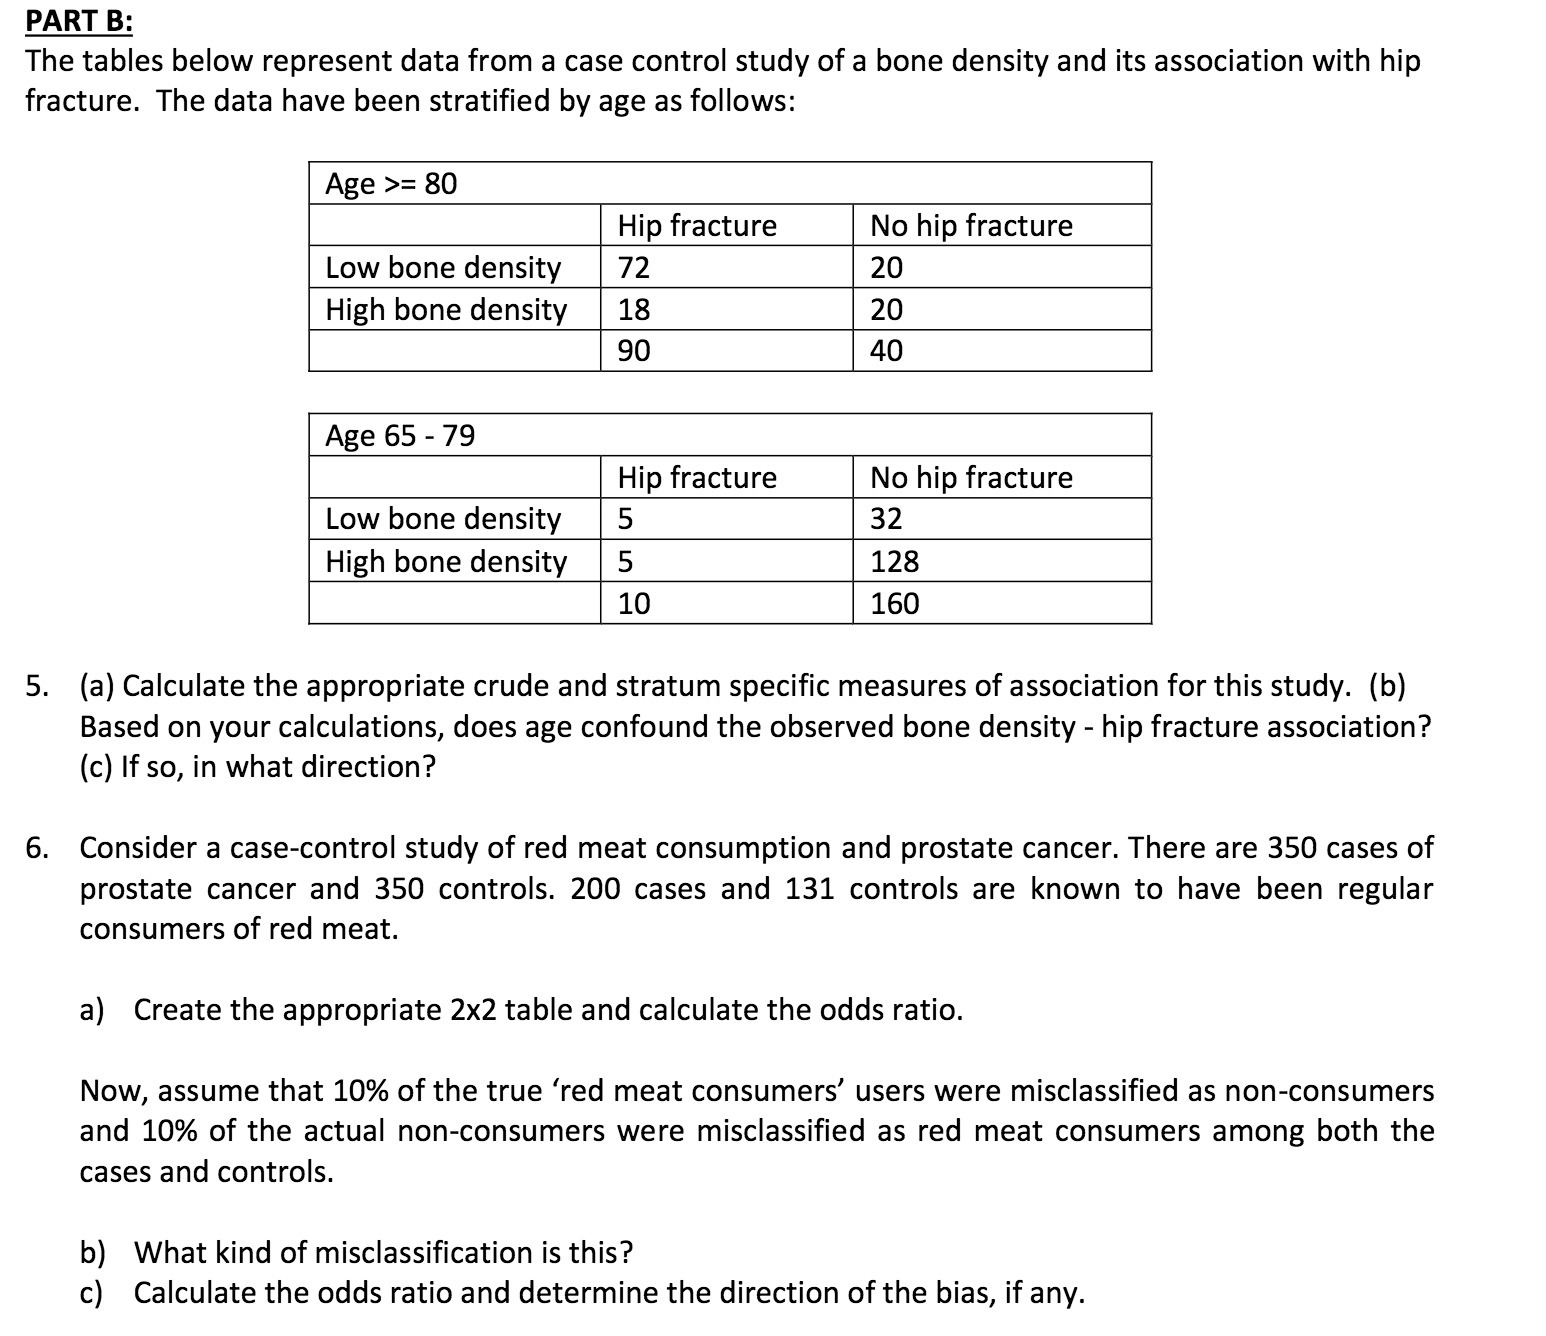
PART B: The tables below represent data from a case control study of a bone density and its association with hip fracture. The data have been stratified by age as follows: 5. Age >= 80 No hip fracture Low bone density 20 High bone density 20 _ _ (a) Calculate the appropriate crude and stratum specific measures of association for this study. (b) Based on your calculations, does age confound the observed bone density - hip fracture association? (c) If so, in what direction? Consider a case-control study of red meat consumption and prostate cancer. There are 350 cases of prostate cancer and 350 controls. 200 cases and 131 controls are known to have been regular consumers of red meat. 3) Create the appropriate 2x2 table and calculate the odds ratio. Now, assume that 10% of the true 'red meat consumers' users were misclassified as non-consumers and 10% of the actual non-consumers were misclassified as red meat consumers among both the cases and controls. b) What kind of misclassification is this? c) Calculate the odds ratio and determine the direction of the bias, if any
Step by Step Solution
There are 3 Steps involved in it

Get step-by-step solutions from verified subject matter experts