

Question: Part B) What is the upper & lower control limit? Construct a x-bar chart for the length in centimeters of a part from the following
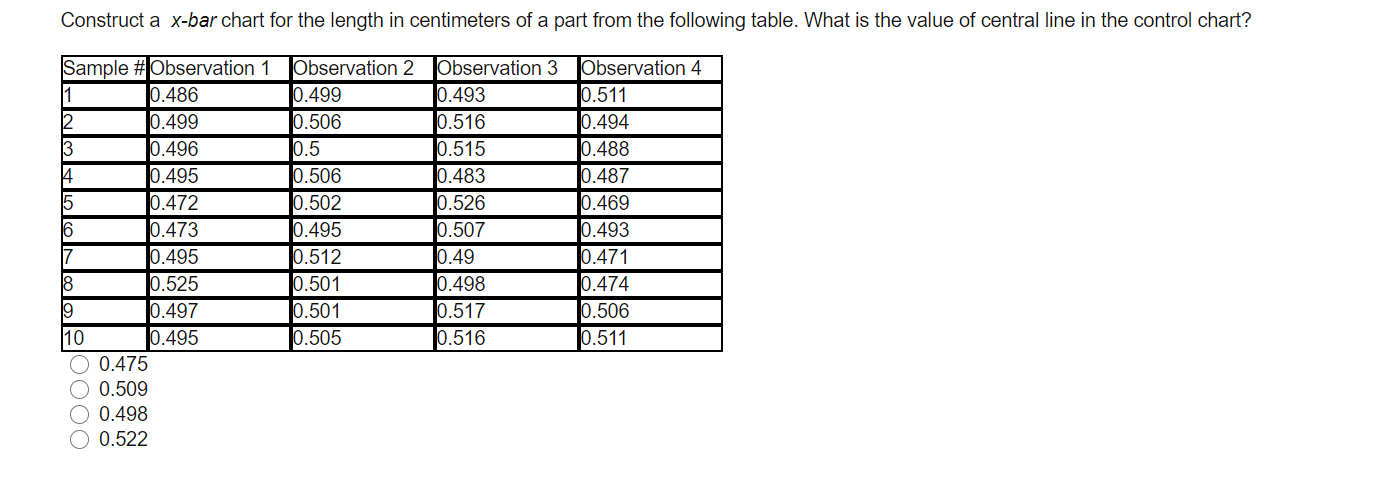 Part B) What is the upper & lower control limit?
Step by Step Solution
There are 3 Steps involved in it
1 Expert Approved Answer
Step: 1 Unlock

Question Has Been Solved by an Expert!
Get step-by-step solutions from verified subject matter experts
Step: 2 Unlock
Step: 3 Unlock