

Question: Part B. When compared to Quarter 2, 2020, are these key financial ratios improving overall in Quarter 3 2020? What reasons could have accounted
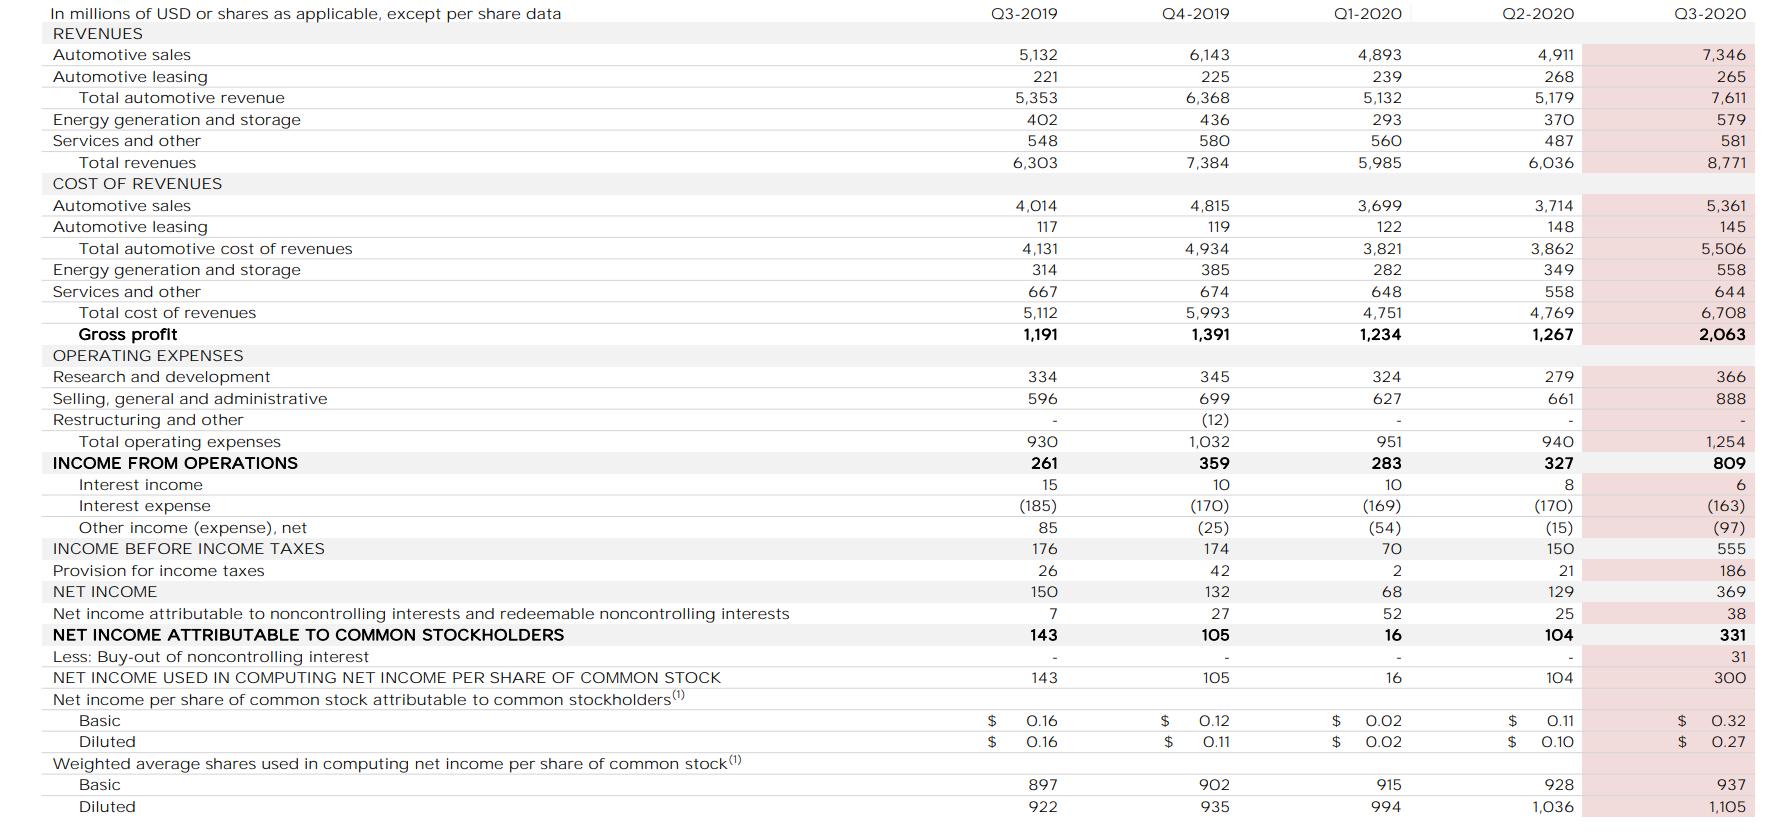
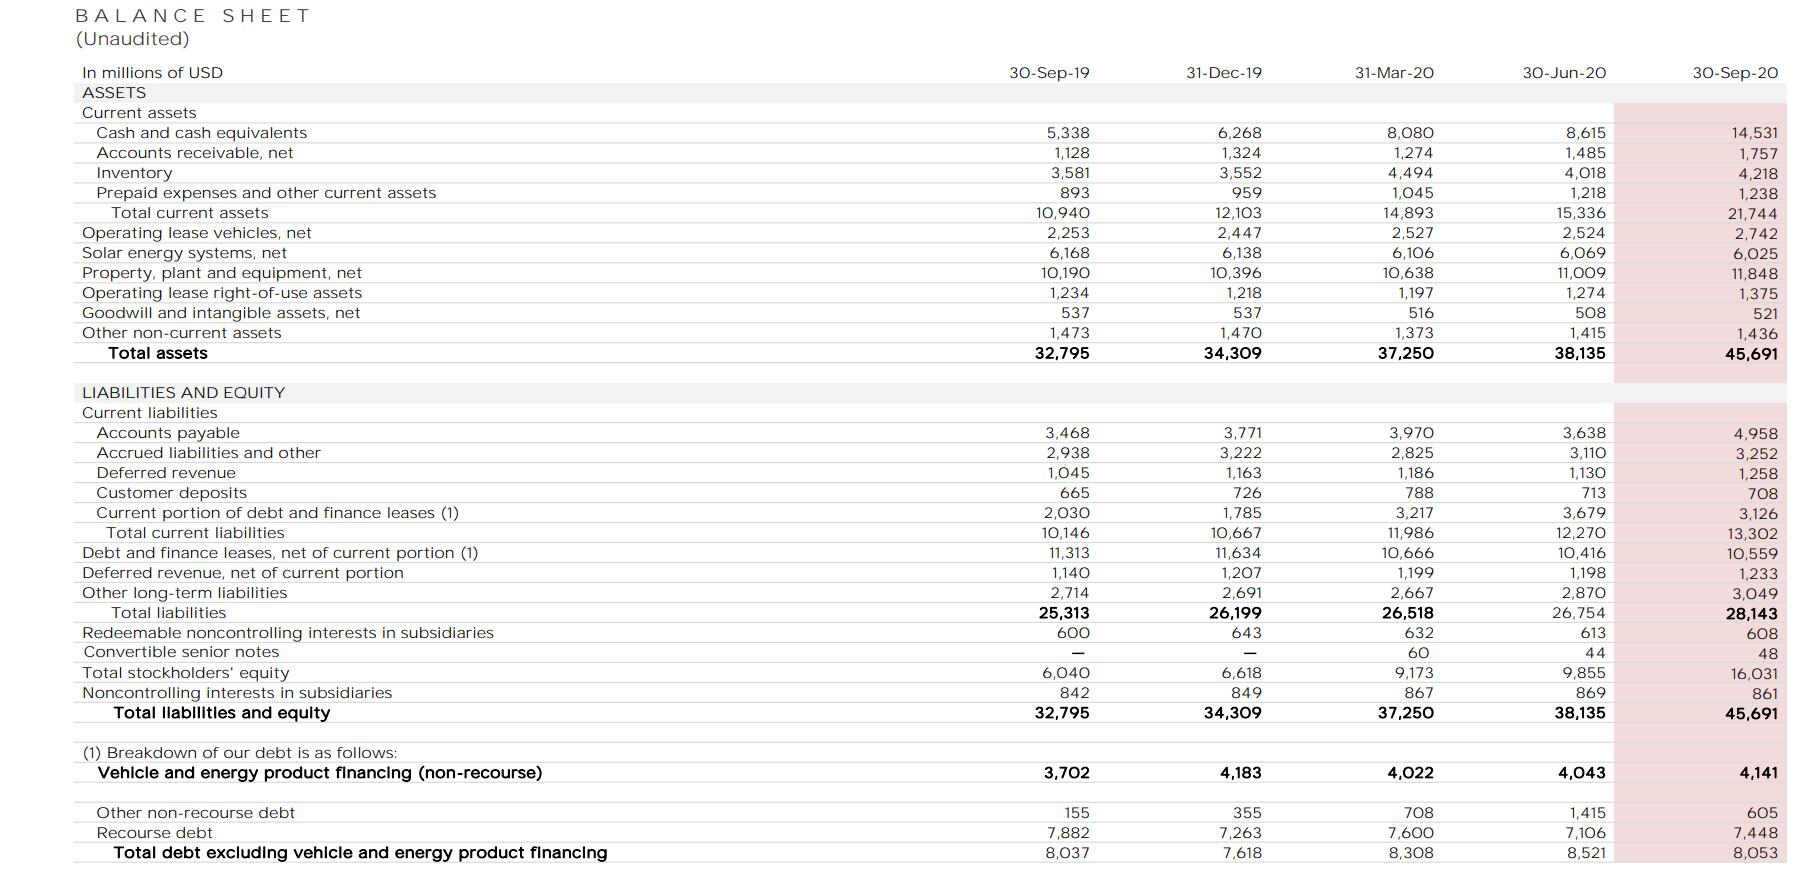
Part B. When compared to Quarter 2, 2020, are these key financial ratios improving overall in Quarter 3 2020? What reasons could have accounted for these changes? 7. Comment on the net income per share attributable to common stockholders for Quarter 3 2020 compared to previous quarters. Do you think the performance in Q3 2020 entices stockholders to invest more in Tesla when compared to previous quarter figures? 8. Prepare a common size analysis of the statement of operations for Q3 2020 & Q2 2020. What are some of the trends you notice? In millions of USD or shares as applicable, except per share data REVENUES Automotive sales Automotive leasing Total automotive revenue Energy generation and storage Services and other Total revenues COST OF REVENUES Automotive sales Automotive leasing Total automotive cost of revenues Energy generation and storage Services and other Total cost of revenues Gross profit OPERATING EXPENSES Research and development Selling, general and administrative Restructuring and other Total operating expenses INCOME FROM OPERATIONS Interest income Interest expense Other income (expense), net INCOME BEFORE INCOME TAXES Provision for income taxes. NET INCOME Net income attributable to noncontrolling interests and redeemable noncontrolling interests NET INCOME ATTRIBUTABLE TO COMMON STOCKHOLDERS Less: Buy-out of noncontrolling interest NET INCOME USED IN COMPUTING NET INCOME PER SHARE OF COMMON STOCK Net income per share of common stock attributable to common stockholders (1) Basic Diluted Weighted average shares used in computing net income per share of common stock (1) Basic Diluted Q3-2019 5,132 221 5,353 402 548 6,303 4,014 117 4,131 314 667 5,112 1,191 334 596 930 261 15 (185) 85 176 26 150 7 143 143 $ 0.16 $ 0.16 897 922 Q4-2019 6,143 225 6,368 436 580 7,384 4,815 119 4,934 385 674 5,993 1,391 345 699 (12) 1,032 359 10 (170) (25) 174 42 132 27 105 105 $ 0.12 $ 0.11 902 935 Q1-2020 4,893 239 5,132 293 560 5,985 LA LA 3,699 122 3,821 282 648 4,751 1,234 324 627 951 283 10 (169) (54) 70 2 68 52 16 16 $ 0.02 $ 0.02 915 994 Q2-2020 4,911 268 5,179 LA LA 370 487 6,036 3,714 148 3,862 349 558 4,769 1,267 279 661 940 327 8 (170) (15) 150 21 129 25 104 104 $ 0.11 $ 0.10 928 1,036 Q3-2020 7,346 265 7,611 579 581 8,771 LA LA 5,361 145 5,506 558 644 6,708 2,063 366 888 1,254 809 6 (163) (97) 555 186 369 38 331 31 300 $ 0.32 $ 0.27 937 1,105 BALANCE SHEET (Unaudited) In millions of USD ASSETS Current assets. Cash and cash equivalents Accounts receivable, net Inventory Prepaid expenses and other current assets Total current assets Operating lease vehicles, net Solar energy systems, net Property, plant and equipment, net Operating lease right-of-use assets Goodwill and intangible assets, net Other non-current assets Total assets LIABILITIES AND EQUITY Current liabilities Accounts payable Accrued liabilities and other Deferred revenue Customer deposits Current portion of debt and finance leases (1) Total current liabilities Debt and finance leases, net of current portion (1) Deferred revenue, net of current portion Other long-term liabilities Total liabilities Redeemable noncontrolling interests in subsidiaries Convertible senior notes Total stockholders' equity Noncontrolling interests in subsidiaries Total liabilities and equity (1) Breakdown of our debt is as follows: Vehicle and energy product financing (non-recourse) Other non-recourse debt Recourse debt Total debt excluding vehicle and energy product financing 30-Sep-19 5,338 1,128 3,581 893 10,940 2,253 6,168 10,190 1,234 537 1,473 32,795 3,468 2,938 1,045 665 2,030 10,146 11,313 1,140 2,714 25,313 600 6,040 842 32,795 3,702 155 7,882 8,037 31-Dec-19 6,268 1,324 3,552 959 12,103 2,447 6,138 10,396 1,218 537 1,470 34,309 3,771 3,222 1,163 726 1,785 10,667 11,634 1,207 2,691 26,199 643 6,618 849 34,309 4,183 355 7,263 7,618 31-Mar-20 8,080 1,274 4,494 1,045 14,893 2,527 6,106 10,638 1,197 516 1,373 37,250 3,970 2,825 1,186 788 3,217 11,986 10,666 1,199 2,667 26,518 632 60 9,173 867 37,250 4,022 708 7,600 8,308 30-Jun-20 8,615 1,485 4,018 1,218 15,336 2,524 6,069 11,009 1,274 508 1,415 38,135 3,638 3,110 1,130 713 3,679 12,270 10,416 1,198 2,870 26,754 613 44 9,855 869 38,135 4,043 1,415 7,106 8,521 30-Sep-20 14,531 1,757 4,218 1,238 21,744 2,742 6,025 11,848 1,375 521 1,436 45,691 4,958 3,252 1,258 708 3,126 13,302 10,559 1,233 3,049 28,143 608 48 16,031 861 45,691 4,141 605 7,448 8,053
Step by Step Solution
There are 3 Steps involved in it
Question 7 Are these key financial ratios improving overall in Quarter 3 2020 compared to Quarter 2 2020 Yesmost key financial ratios improved overall ... View full answer

Get step-by-step solutions from verified subject matter experts