

Question: PART B: Written Questions. Please answer both questions, (40% each) 1. A large Irish sample survey asked each individual to describe their own health levels
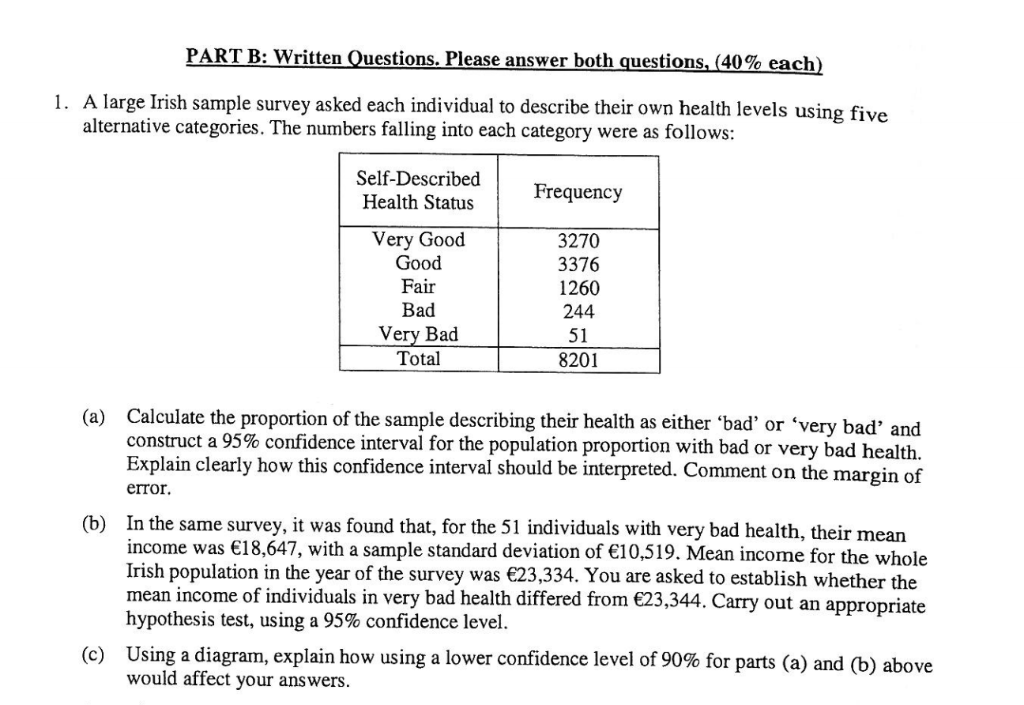
PART B: Written Questions. Please answer both questions, (40% each) 1. A large Irish sample survey asked each individual to describe their own health levels using five alternative categories. The numbers falling into each category were as follows: Self-Described Frequency Health Status Very Good Good 3270 3376 1260 244 air Bad Very Bad Total 51 8201 Calculate the proportion of the sample describing their health as either 'bad' or 'very bad' a construct a 95% confidence interval for the population proportion with bad or very bad health Explain clearly how this confidence interval should be interpreted. Comment on the margin of (a) error. In the same survey, it was found that, for the 51 i income was 18,647, with a sample standard deviation of 10,519. Mean income for the whole Irish population in the year of the survey was 23,334. You are asked to establish whether the mean income of individuals in very bad health differed from 23,344. Carry out an appropriate hypothesis test, using a 95% confidence level. (b) ndividuals with very bad health, their mean Using a diagram, explain how using a lower confidence level of 90% for parts (a) and (b) above would affect your answers. PART B: Written Questions. Please answer both questions, (40% each) 1. A large Irish sample survey asked each individual to describe their own health levels using five alternative categories. The numbers falling into each category were as follows: Self-Described Frequency Health Status Very Good Good 3270 3376 1260 244 air Bad Very Bad Total 51 8201 Calculate the proportion of the sample describing their health as either 'bad' or 'very bad' a construct a 95% confidence interval for the population proportion with bad or very bad health Explain clearly how this confidence interval should be interpreted. Comment on the margin of (a) error. In the same survey, it was found that, for the 51 i income was 18,647, with a sample standard deviation of 10,519. Mean income for the whole Irish population in the year of the survey was 23,334. You are asked to establish whether the mean income of individuals in very bad health differed from 23,344. Carry out an appropriate hypothesis test, using a 95% confidence level. (b) ndividuals with very bad health, their mean Using a diagram, explain how using a lower confidence level of 90% for parts (a) and (b) above would affect your answers
Step by Step Solution
There are 3 Steps involved in it

Get step-by-step solutions from verified subject matter experts