

Question: PART C: Analytical Question QUESTION 2 (Time: 10-15 minutes) Using the following data of Baskins & Robbins shop answer the following questions: No. of ice
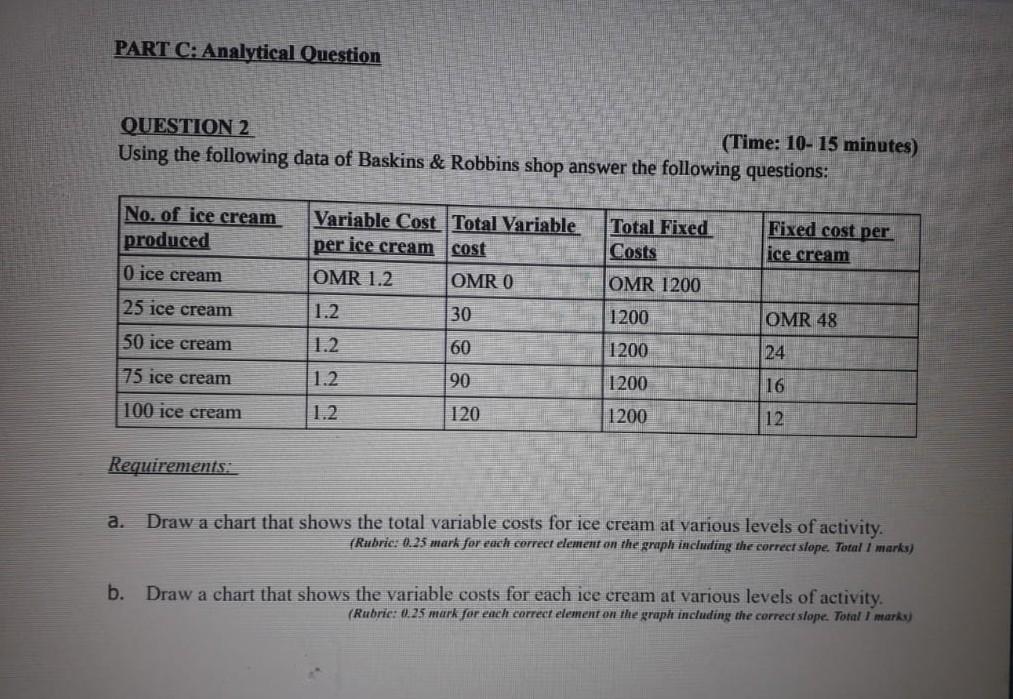
PART C: Analytical Question QUESTION 2 (Time: 10-15 minutes) Using the following data of Baskins & Robbins shop answer the following questions: No. of ice cream produced Variable Cost Total Variable per ice cream cost OMR 1.2 OMRO Total Fixed Costs Fixed cost per ice cream O ice cream OMR 1200 25 ice cream 1.2 30 50 ice cream 1200 1200 1.2 OMR 48 24 60 75 ice cream 11.2 190 1200 16 100 ice cream 1.2 120 1200 12 Requirements: a. Draw a chart that shows the total variable costs for ice cream at various levels of activity. FRubric: 0.25 mark for each correct element on the graph including the correct slope. Total 1 marks) b. Draw a chart that shows the variable costs for each ice cream at various levels of activity. (Rubric: 0.25 mark for each correct element on the graph including the correct slope. Total marks)
Step by Step Solution
There are 3 Steps involved in it

Get step-by-step solutions from verified subject matter experts