

Question: Part C & D Q2 (Using price elasticities to understand the competitive structure of a market) (8 points) The excel file and the regression output
Part C & D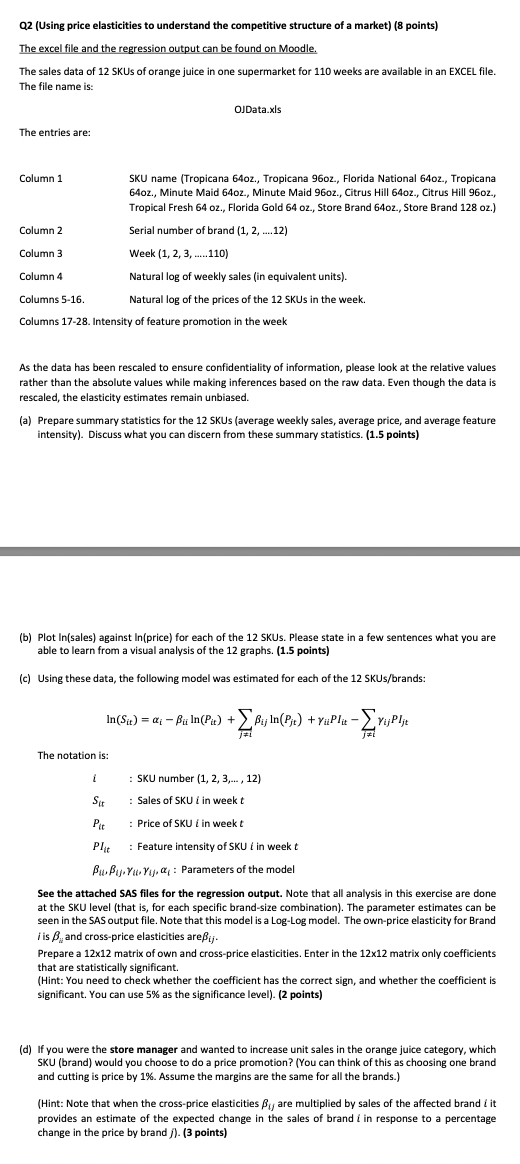
Q2 (Using price elasticities to understand the competitive structure of a market) (8 points) The excel file and the regression output can be found on Moodle. The sales data of 12 SKUs of orange juice in one supermarket for 110 weeks are available in an EXCEL file. The file name is: OJData.xls The entries are: Column 1 SKU name (Tropicana 64oz., Tropicana 96oz., Florida National 64oz., Tropicana 64oz., Minute Maid 64oz., Minute Maid 96oz., Citrus Hill 64oz., Citrus Hill 960z, Tropical Fresh 64 oz., Florida Gold 64 oz., Store Brand 640z., Store Brand 128 oz.) Column 2 Serial number of brand (1,2,.12) Column 3 Week (1,2,3,..110) Column 4 Natural log of weekly sales (in equivalent units). Columns 5-16. Natural log of the prices of the 12 SKUs in the week. Columns 17-28. Intensity of feature promotion in the week As the data has been rescaled to ensure confidentiality of information, please look at the relative values rather than the absolute values while making inferences based on the raw data. Even though the data is rescaled, the elasticity estimates remain unbiased. (a) Prepare summary statistics for the 12 SKUs (average weekly sales, average price, and average feature intensity). Discuss what you can discern from these summary statistics. (1.5 points) (b) Plot In(sales) against In(price) for each of the 12 SKUs. Please state in a few sentences what you are able to learn from a visual analysis of the 12 graphs. (1.5 points) (c) Using these data, the following model was estimated for each of the 12SKUs/brands : ln(Sit)=iiiln(Pit)+j=iijln(Pjt)+iiPIitj=iijPljt The notation is: iSitPitPIitit,ij,ii,ij,i:Parametersofthemodel:SKUnumber(1,2,3,,12):SalesofSKUiinweekt:PriceofSKUiinweekt:FeatureintensityofSKUiinweekt See the attached SAS files for the regression output. Note that all analysis in this exercise are done at the SKU level (that is, for each specific brand-size combination). The parameter estimates can be seen in the SAS output file. Note that this model is a Log-Log model. The own-price elasticity for Brand i is u and cross-price elasticities are ij. Prepare a 1212 matrix of own and cross-price elasticities. Enter in the 1212 matrix only coefficients that are statistically significant. (Hint: You need to check whether the coefficient has the correct sign, and whether the coefficient is significant. You can use 5% as the significance level). (2 points) (d) If you were the store manager and wanted to increase unit sales in the orange juice category, which SKU (brand) would you choose to do a price promotion? (You can think of this as choosing one brand and cutting is price by 1%. Assume the margins are the same for all the brands.) (Hint: Note that when the cross-price elasticities ij are multiplied by sales of the affected brand i it provides an estimate of the expected change in the sales of brand i in response to a percentage change in the price by brand j ). (3 points)
Step by Step Solution
There are 3 Steps involved in it

Get step-by-step solutions from verified subject matter experts