

Question: PART C: Now that you've built the program, run the program and analyze the data. Using a piece of graph paper, neatly graph the Normal
PART C:
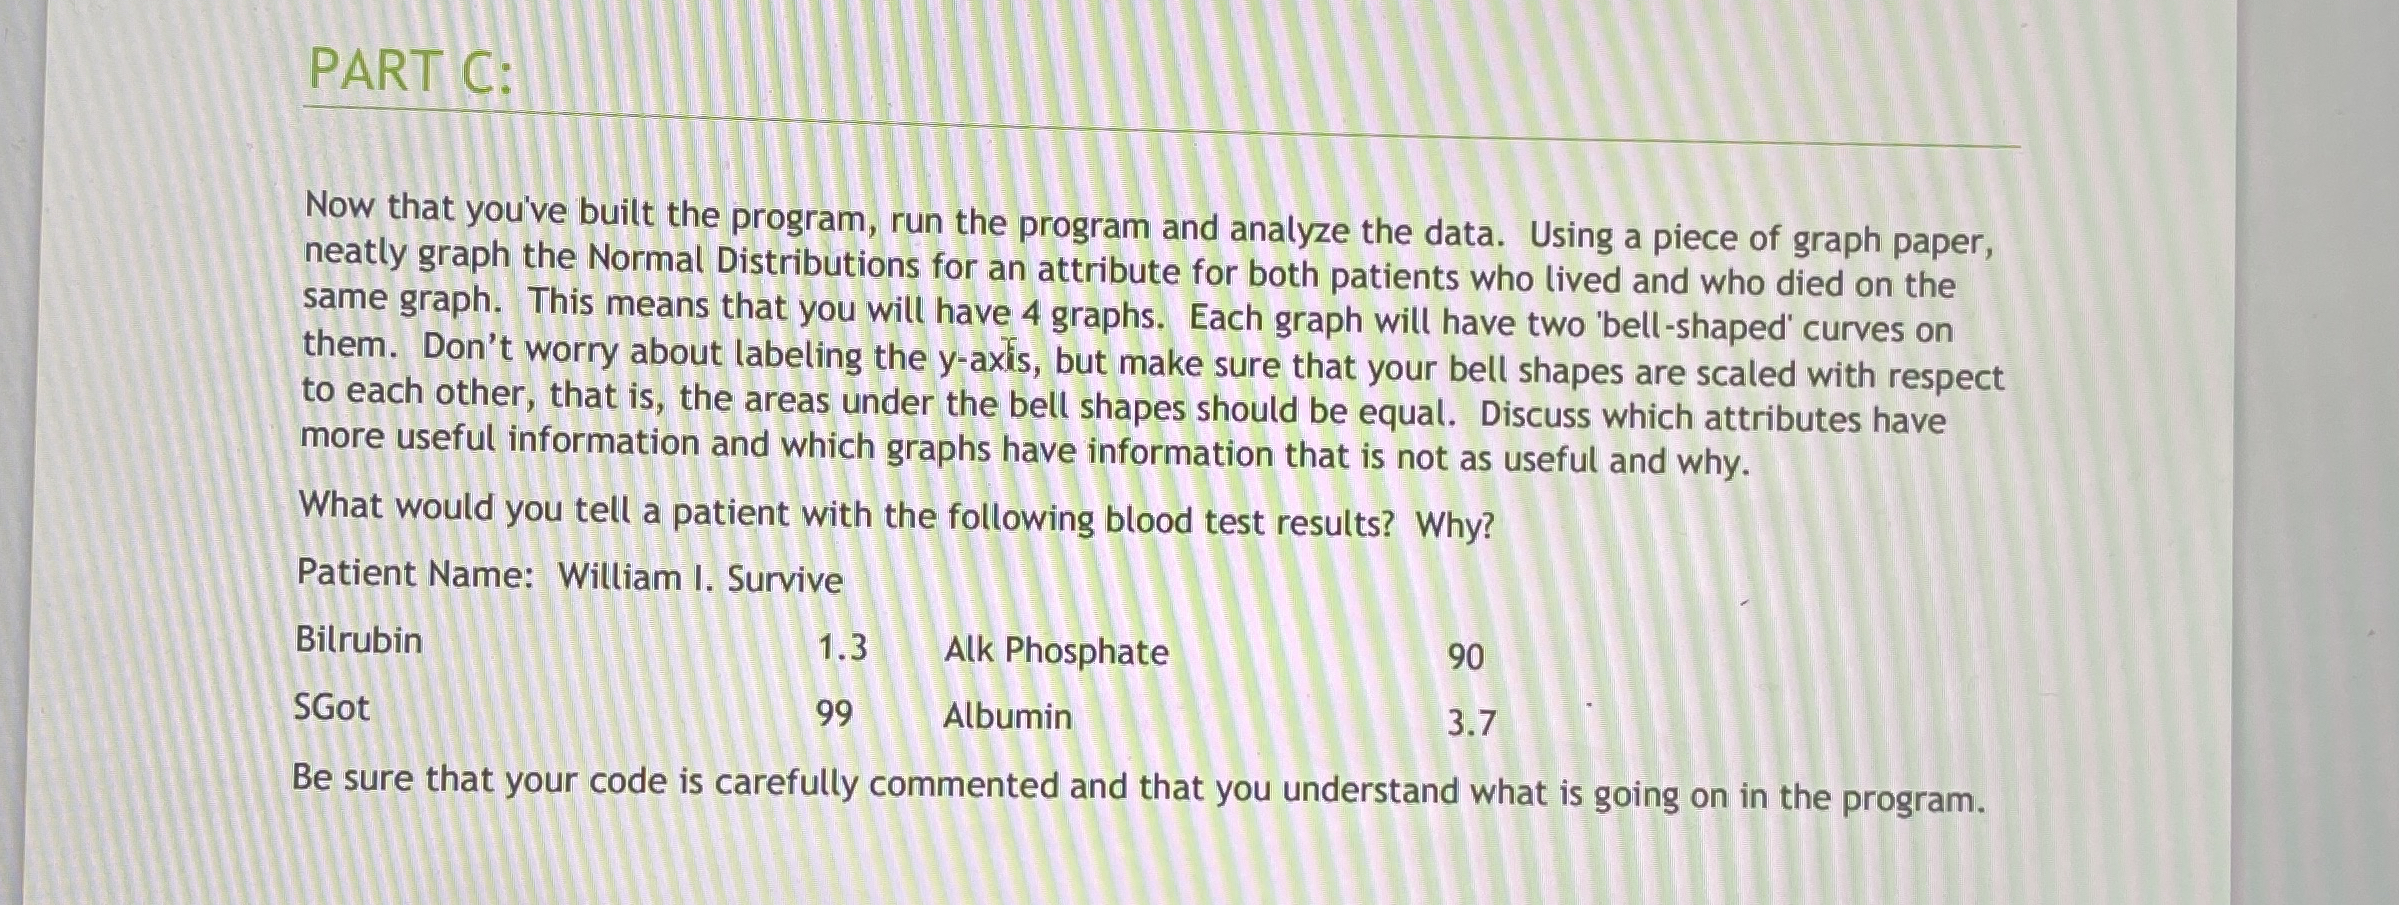
Now that you've built the program, run the program and analyze the data. Using a piece of graph paper, neatly graph the Normal Distributions for an attribute for both patients who lived and who died on the same graph. This means that you will have graphs. Each graph will have two 'bellshaped' curves on them. Don't worry about labeling the axis, but make sure that your bell shapes are scaled with respect to each other, that is the areas under the bell shapes should be equal. Discuss which attributes have more useful information and which graphs have information that is not as useful and why.
What would you tell a patient with the following blood test results? Why?
Patient Name: William I. Survive
Bilrubin
Alk Phosphate
SGot
Albumin
Be sure that your code is carefully commented and that you understand what is going on in the program.
Step by Step Solution
There are 3 Steps involved in it
1 Expert Approved Answer
Step: 1 Unlock

Question Has Been Solved by an Expert!
Get step-by-step solutions from verified subject matter experts
Step: 2 Unlock
Step: 3 Unlock