

Question: Part C: Selected Response Questions. Circle the correct answer. 1. A broken line diagram is used to show: a) the change in quantitative results over

Part C: Selected Response Questions. Circle the correct answer. 1. A broken line diagram is used to show: a) the change in quantitative results over time b) the variation of the quantitative results over time c) the evolution of the quantitative results over time d) all of the above
2. Here is a question from a survey: The majority of your courses are of what type? ? pre-employment ? pre-college ? pre-university
This is a question: a) informative b) multiple choice c) with classification d) with a ladder
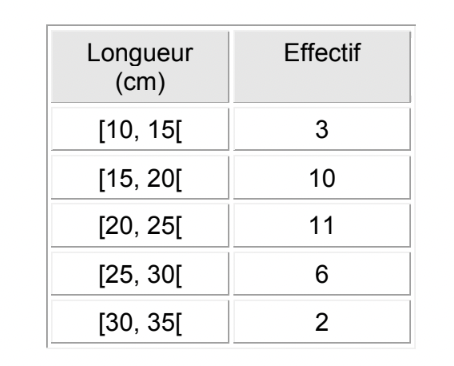
3. The value of one of the measures of central tendency of the set of given below is about 22.5. What measures are these?


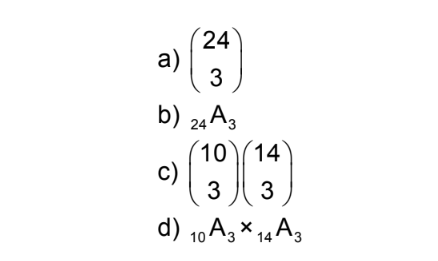
Longueur Effectif (cm) [10, 15[ 3 [15, 20[ 10 [20, 25[ 11 [25, 30[ 6 [30, 35[ 2\f24 a) 3 b ) 24 A3 10 14 C 3 3 d) 10 A3 X 14 A;
Step by Step Solution
There are 3 Steps involved in it

Get step-by-step solutions from verified subject matter experts