

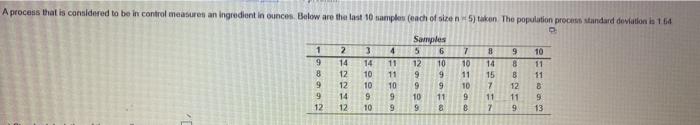
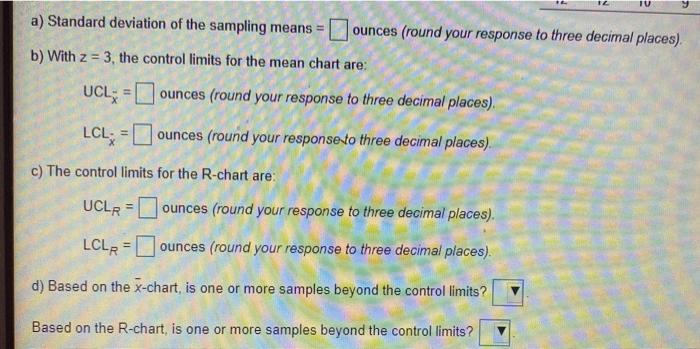
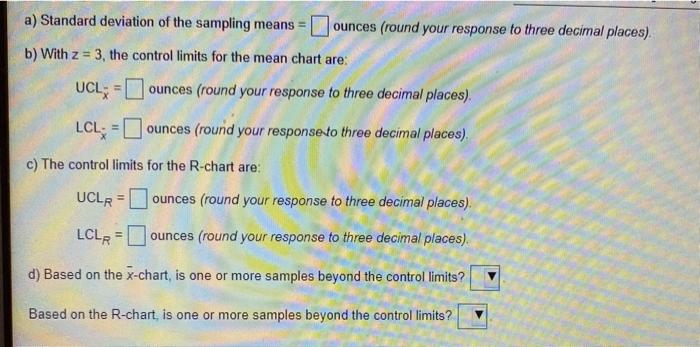
Question: part d is a yes or no answer A process that is couldered to be in control measures an Ingredient in ounce. Below are the
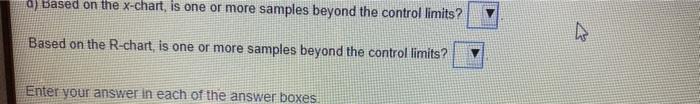 part d is a yes or no answer
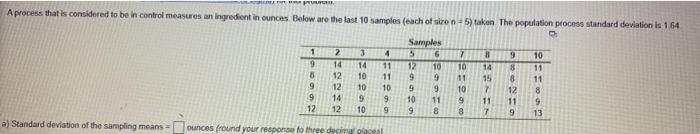
Step by Step Solution
There are 3 Steps involved in it
1 Expert Approved Answer
Step: 1 Unlock

Question Has Been Solved by an Expert!
Get step-by-step solutions from verified subject matter experts
Step: 2 Unlock
Step: 3 Unlock