Question: Part D. Question 6. Simple Process Control Chart 1 An experiment was conducted on the quality characteristic of length. The measurement of each item in

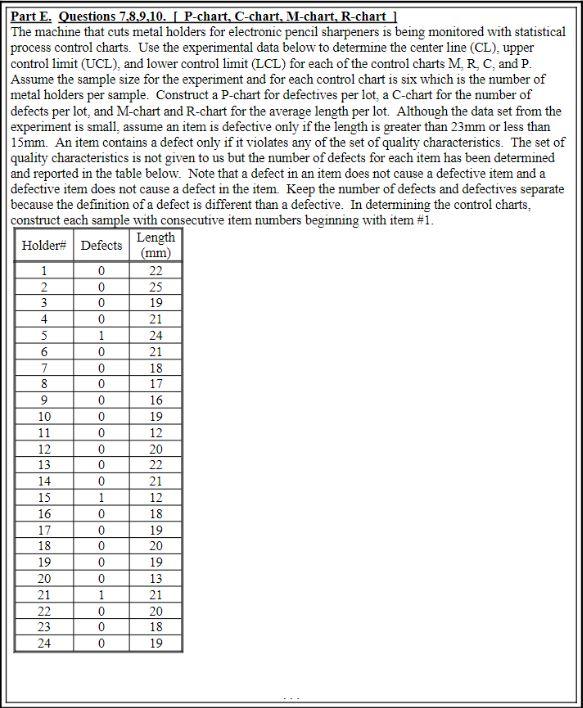
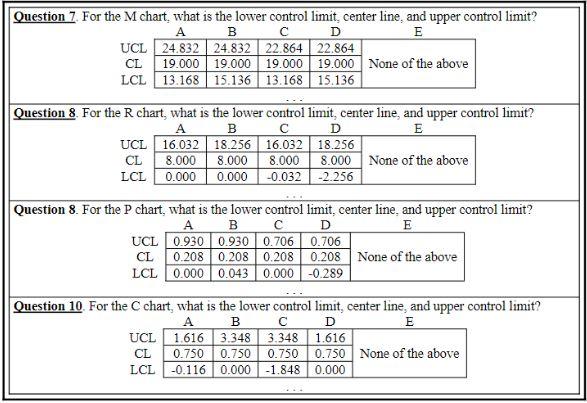
Part D. Question 6. Simple Process Control Chart 1 An experiment was conducted on the quality characteristic of length. The measurement of each item in millimeters (MM) was recorded Item# 1 2 3 4 5 6 7 MM 47 49 51 50 47 50 49 Construct a chart using the sample size of 7. (Hint: Use Population Variance.) What is the upper control limit center line, and lower control limit for the process control chart? (A) UCL: 49.53 CL: 49.00 LCL: 48.47 (B) (C) (D) 50.41 50.60 53.24 49.00 49.00 49.00 47.59 47.40 44.76 (E) None of The Above Part E. Questions 7,8,9,10. IP-chart, C-chart, M-chart, R-chart The machine that cuts metal holders for electronic pencil sharpeners is being monitored with statistical process control charts. Use the experimental data below to determine the center line (CL), upper control limit (UCL), and lower control limit (LCL) for each of the control charts MR C and P. Assume the sample size for the experiment and for each control chart is six which is the number of metal holders per sample. Construct a P-chart for defectives per lot, a C-chart for the number of defects per lot, and M-chart and R-chart for the average length per lot. Although the data set from the experiment is small, assume an item is defective only if the length is greater than 23mm or less than 15mm. An item contains a defect only if it violates any of the set of quality characteristics. The set of quality characteristics is not given to us but the number of defects for each item has been determined and reported in the table below. Note that a defect in an item does not cause a defective item and a defective item does not cause a defect in the item Keep the number of defects and defectives separate because the definition of a defect is different than a defective. In determining the control charts. construct each sample with consecutive item numbers beginning with item #1. Length Holder# Defects (mm) 0 22 2 25 19 4 21 1 3 5 6 7 8 9 10 11 12 13 14 15 16 17 18 19 20 21 22 23 24 0 0 0 1 0 0 0 0 0 0 0 0 0 1 0 24 21 18 17 16 19 12 20 22 21 12 18 19 20 19 13 21 20 18 19 lalu 0 0 0 0 1 0 0 0 Question 7. For the M chart, what is the lower control limit center line, and upper control limit? A B D E UCL 24.832 24.832 22.864 22.864 CL 19.000 19.000 19.000 19.000 None of the above LCL | 13.168 15.136 13.168 15.136 Question 8. For the R chart, what is the lower control limit, center line, and upper control limit? A B D E UCL 16.032 18.256 16.032 18.256 CL 8.000 8.000 8.000 8.000 None of the above LCL 0.000 0.000 -0.032 -2.256 Question 8. For the P chart, what is the lower control limit center line and upper control limit? A B . D E UCL 0.930 0.930 0.706 0.706 CL 0.208 0.208 0.208 0.208 None of the above LCL | 0.000 | 0.043 | 0.000 | -0.289 Question 10. For the chart, what is the lower control limit center line, and upper control limit? A B D UCL 1.616 3.348 3.348 1.616 CL 0.750 0.750 0.750 0.750 None of the above LCL -0.116 0.000-1.848 0.000


