

Question: Part D Use statistical software to construct a 99% confidence interval for the mean monthly cell phone bill. The results of a question asked in
Part D Use statistical software to construct a 99% confidence interval for the mean monthly cell phone bill.
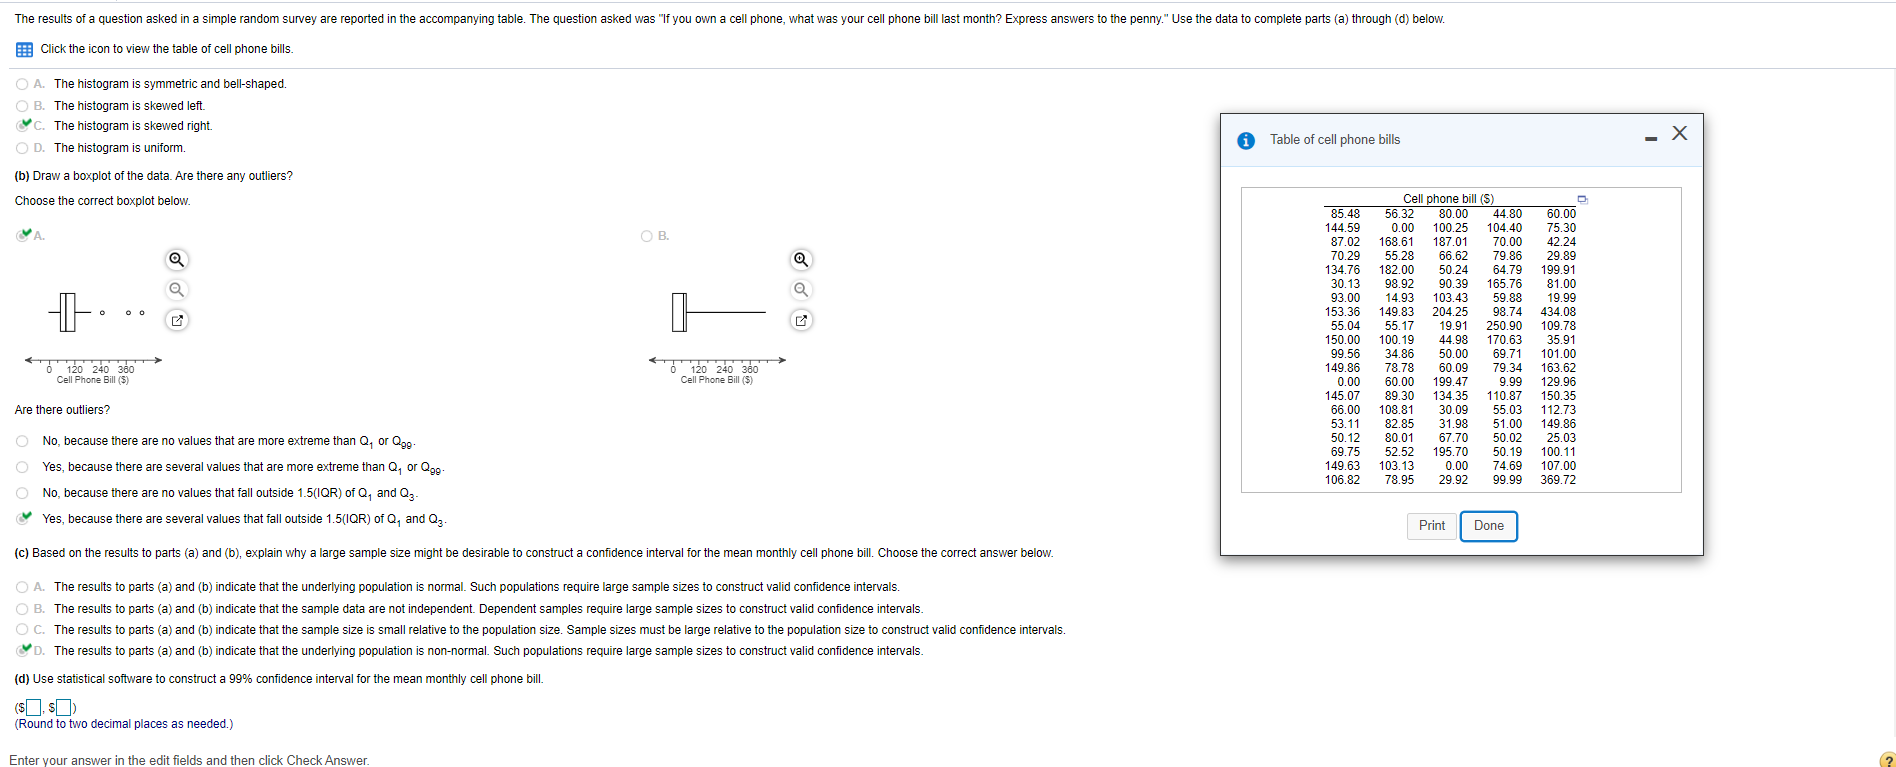
The results of a question asked in a simple random survey are reported in the accompanying table. The question asked was "If you own a cell phone, what was your cell phone bill last month? Express answers to the penny." Use the data to complete parts (a) through (d) below. Click the icon to view the table of cell phone bills. O A. The histogram is symmetric and bell-shaped. O B. The histogram is skewed left. C. The histogram is skewed right. O D. The histogram is uniform. i Table of cell phone bills - X (b) Draw a boxplot of the data. Are there any outliers? Choose the correct boxplot below. Cell phone bill (S) 85.48 56.32 80.00 44.80 60.00 B. 144.59 0.00 100.25 104.40 87.02 168.61 187.01 75.30 42.24 70.29 55.28 66.62 70.00 50 24 79.86 29.89 134.76 182.00 64.79 199.91 30.13 98.92 90.39 165.76 81.00 93.00 14.93 103.43 59.88 19.99 53.36 149.83 204.25 19.91 98.74 434.08 55.04 55.17 150.00 250.90 109.78 100.19 44.98 170.63 35.91 99.56 34.86 50.00 101.00 0 120 240 69.71 Cell Phone Bill ($) 120 240 380 Cell Phone Bill ($) 49.86 78.78 60.09 79.34 163.62 0.00 60.00 199.47 9.99 134.35 1 10.87 129.96 145.07 89.30 150.35 Are there outliers? 66.00 108.81 30.09 55.03 51.00 112.73 53.11 82.85 31.98 149.86 No, because there are no values that are more extreme than Q, or Ogg. 50.12 80.01 67.70 50.02 25.03 69.75 52.52 195.70 149.63 103.13 50.19 100.11 Yes, because there are several values that are more extreme than Q, or Ogg. 0.00 74.69 107.00 106.82 78.95 29.92 99.99 No, because there are no values that fall outside 1.5(IQR) of Q, and Q3- 369.72 Yes, because there are several values that fall outside 1.5(IQR) of Q, and Q3 Print Done (c) Based on the results to parts (a) and (6), explain why a large sample size might be desirable to construct a confidence interval for the mean monthly cell phone bill. Choose the correct answer below. O A. The results to parts (a) and (b) indicate that the underlying population is normal. Such populations require large sample sizes to construct valid confidence intervals. B. The results to parts (a) and (b) indicate that the sample data are not independent. Dependent samples require large sample sizes to construct valid confidence intervals O C. The results to parts (a) and (b) indicate that the sample size is small relative to the population size. Sample sizes must be large relative to the population size to construct valid confidence intervals. D. The results to parts (a) and (b) indicate that the underlying population is non-normal. Such populations require large sample sizes to construct valid confidence intervals. (d) Use statistical software to construct a 99% confidence interval for the mean monthly cell phone bill. (Round to two decimal places as needed.)
Step by Step Solution
There are 3 Steps involved in it

Get step-by-step solutions from verified subject matter experts