

Question: Part DI. (This part is designed to help you work on your project. Please do use vour computer to work on this part!) The data

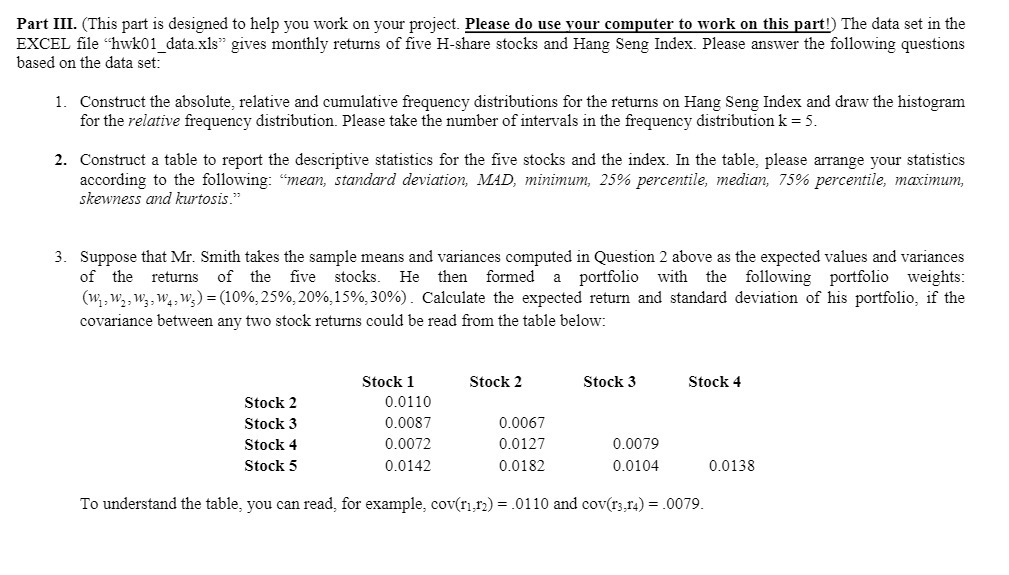
Part DI. (This part is designed to help you work on your project. Please do use vour computer to work on this part!) The data set in the EXCEL le "hwk01_data_x1s" gives monthly returns of ve Hshare stocks and Hang Seng index. Please answer the following questions based on the data set: 1. Construct the absolute. relative and cumulative frequency distributions for the returns on Hang Seng Index and draw the histogram for the relative frequenC}r distribution. Please take the number of intervals in the frequency distribution 1: = 5. Construct a table to report the descriptive statistics for the ve stocks and the index In the table. please arrange your statistics according to the following: "mean, standm'd deviation, 4WD, minimum, 25% percentile, median, 75% percentile, maximum, skewness and Mitosis." Suppose that Mr. Smith takes the sample means and variances computed in Question 2 above as the expected values and variances of the returns of the ve stocks. He then formed a portfolio with the following portfolio weights: (wliwpwyuhws) = (10%, 25%:20%:15%,30%) . Calculate the expected return and standard deviation of his portfolio, if the covariance between any two stock returns could be read 'om the table below: Stock 1 Stock 2 Stock 3 Stock 4 Stock 2 0.0] 10 Stock 3 0.008? 0.006 7" Stock 4 0.0072 0.012 7 (10039 Stock 5 0.0142 0.0182 0.0104 0.013 3 To understand the table, you can read. for example, cov(rl ,r2) = .0110 and cov(r3 ,r4) = .0079
Step by Step Solution
There are 3 Steps involved in it

Get step-by-step solutions from verified subject matter experts