

Question: PART E Buffers To illustrate how buffers affect the operational performance of a process with variability, we return to the scenario from Part D: a
PART E
Buffers
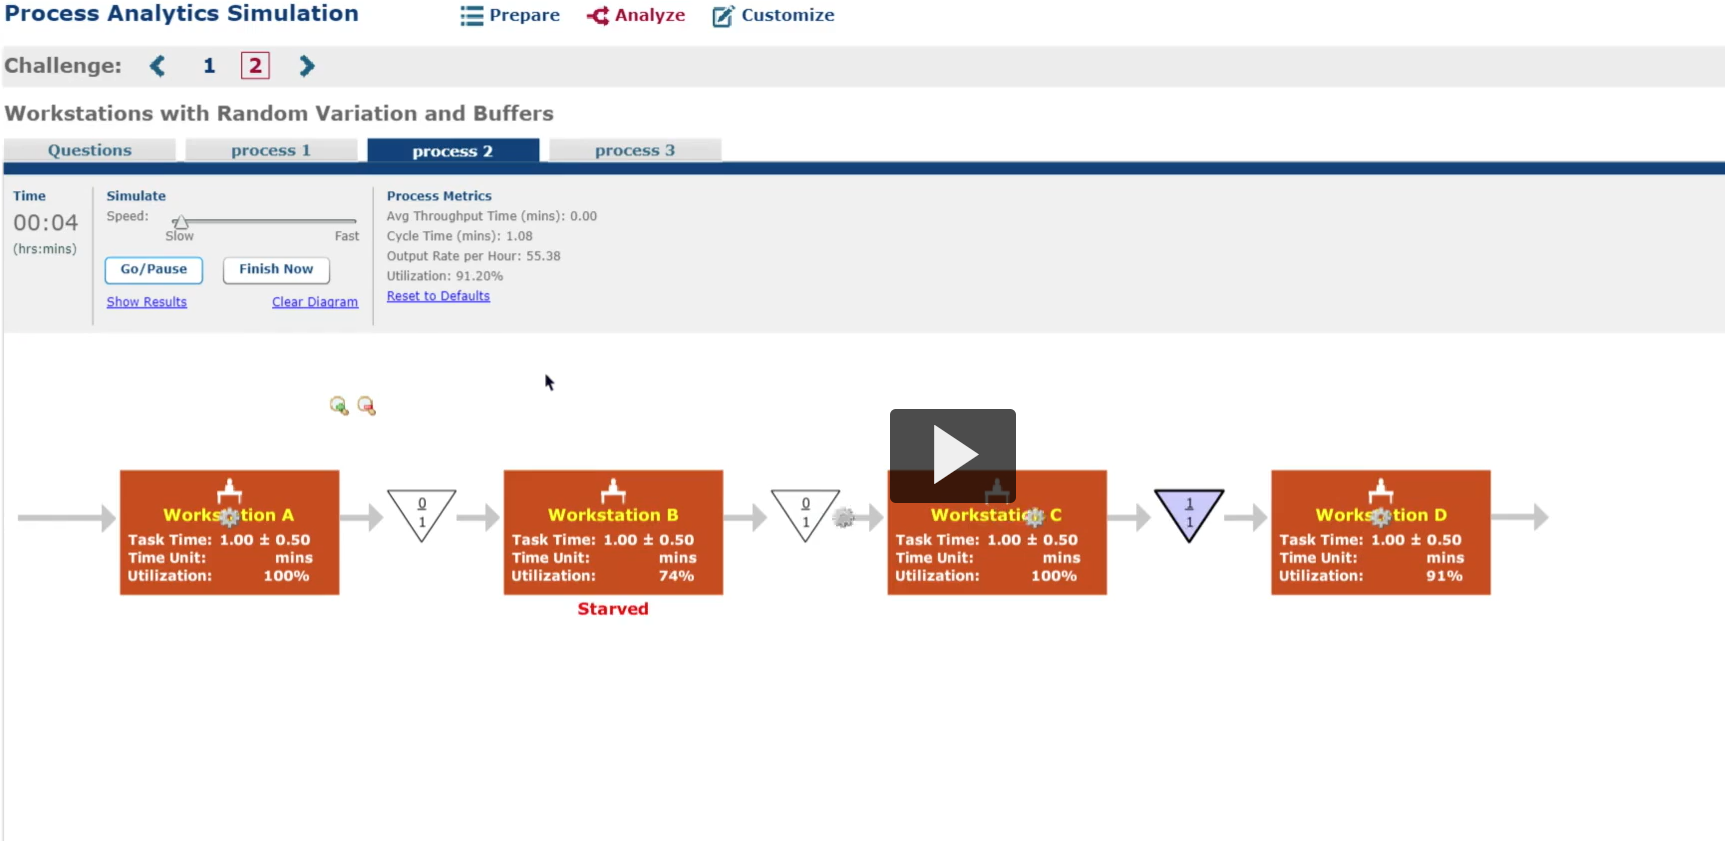
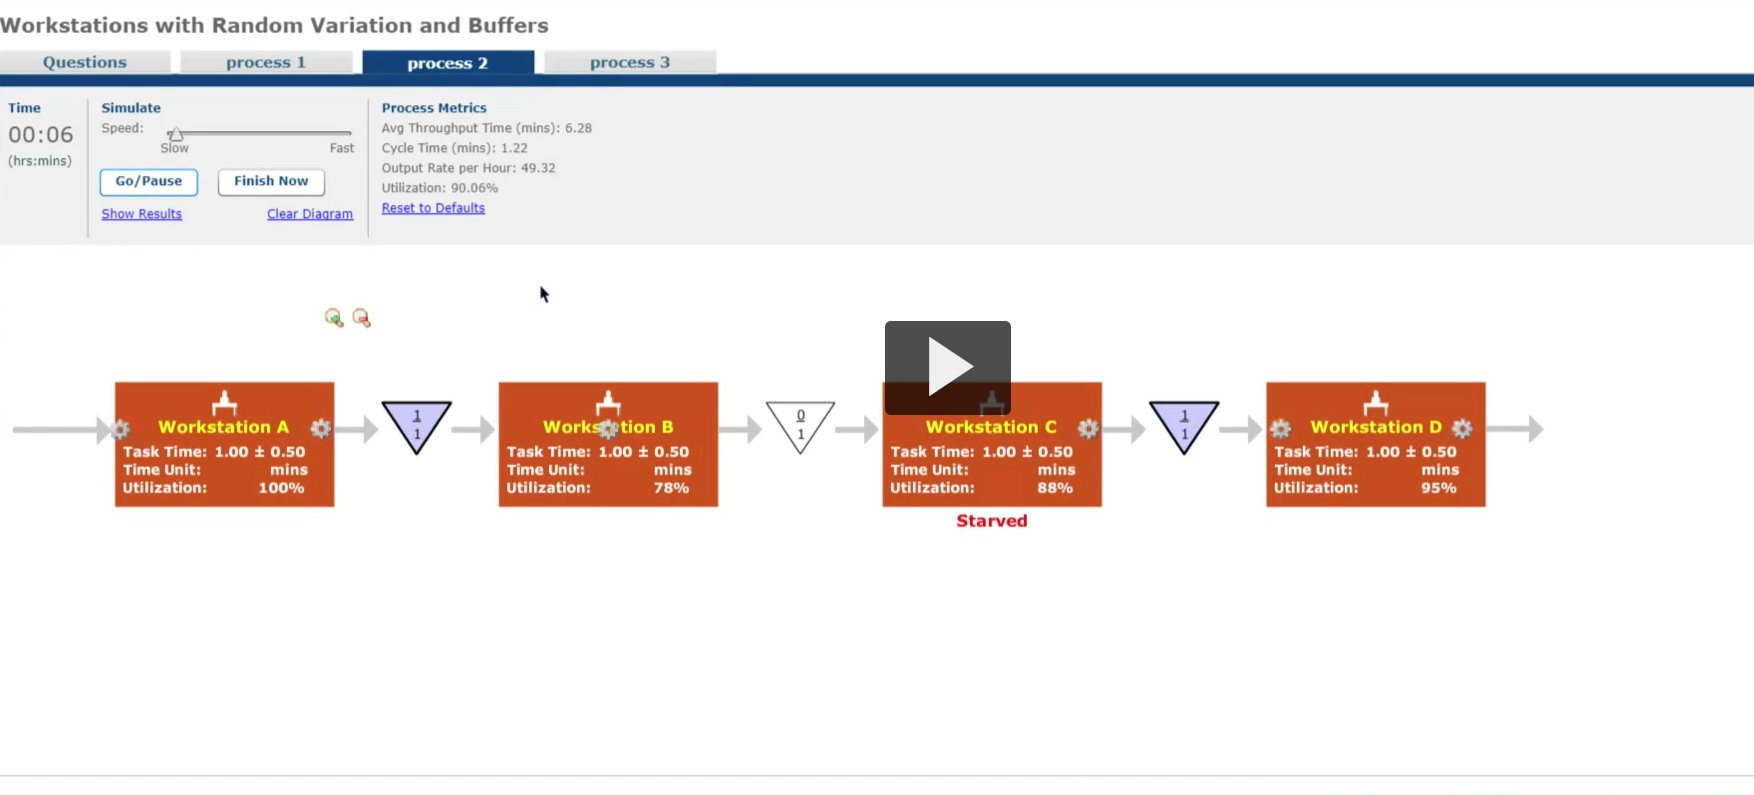
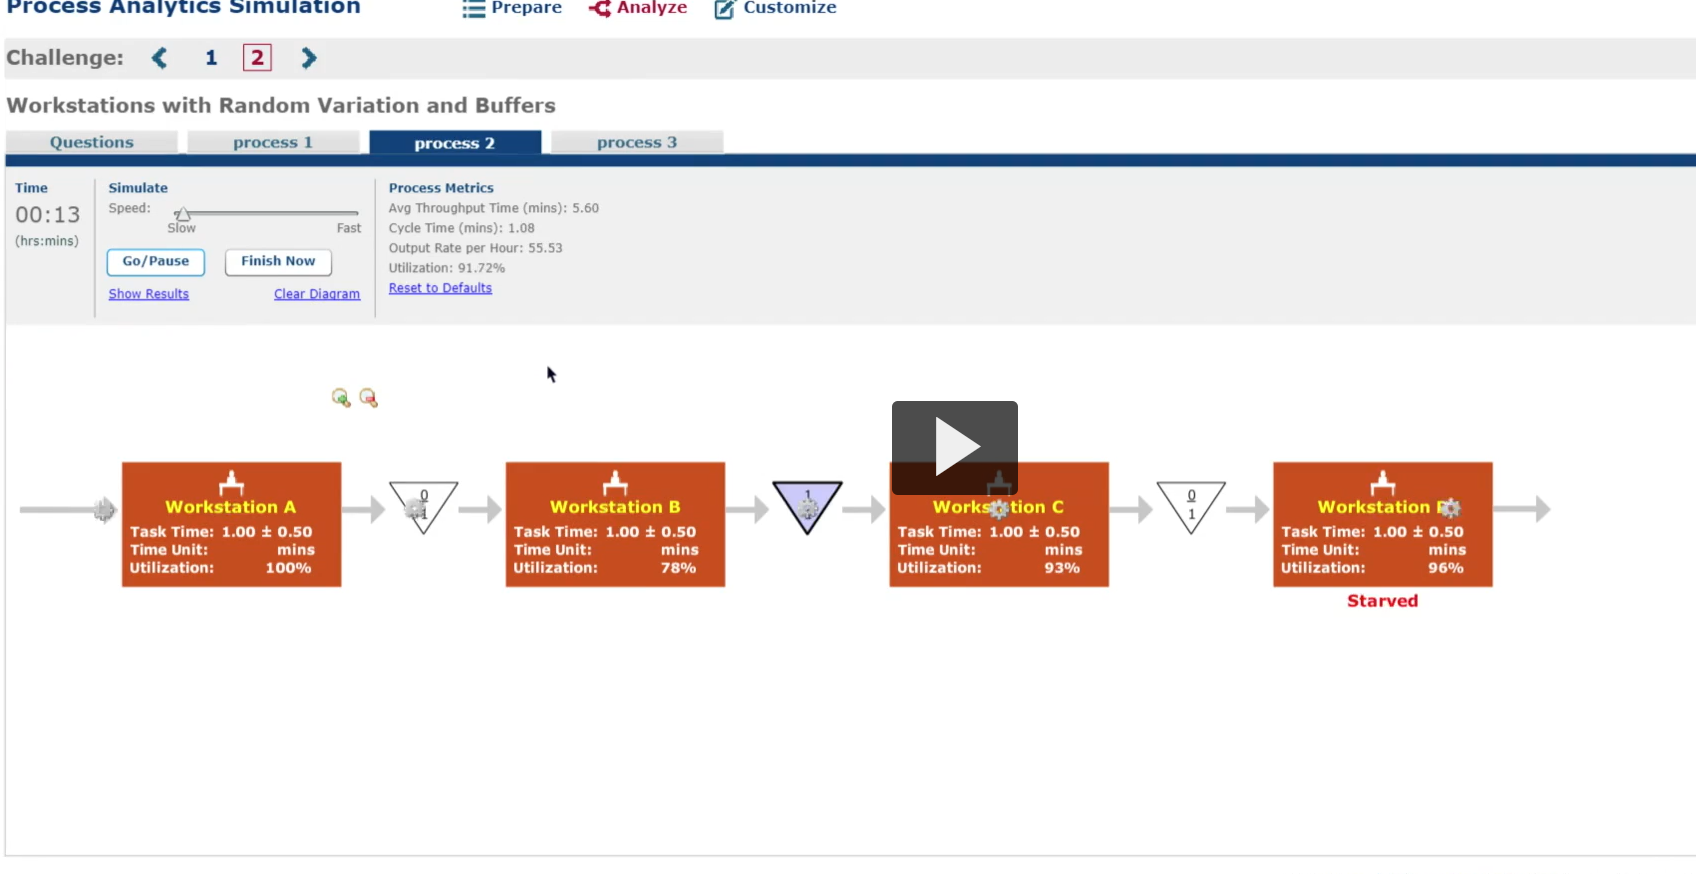
To illustrate how buffers affect the operational performance of a process with variability, we return to the scenario from Part D: a four-workstation process where the processing time of each workstation varies along a uniform distribution from 0.5 to 1.5 minutes. In this instance, however, a buffer that can hold one unit of work-in-process inventory is placed between the four workstations. From your work in Part B, review the workstation utilization and line output for the 480-minute period. How do you anticipate the buffer will affect the utilization of each workstation and the line output? After thinking about these questions, click start to play the video and observe the line output and workstations' utilization.
8. Based on these results, how do line output, throughput time, and workstations' utilization differ from those for the process in Part B (which is otherwise the same) when we add a one-unit buffer? Why?
Step by Step Solution
There are 3 Steps involved in it

Get step-by-step solutions from verified subject matter experts