Question: Part Four-Problem: show all work Answer all five questions (5 points each; 25 points total) 1. Create in excel (and submit by attaching to an

Part Four-Problem: show all work Answer all five questions (5 points each; 25 points total) 1. Create in excel (and submit by attaching to an email) the yield curve for a date you are assigned for January 2022. Provide a summary statement interpreting this yield curve. (SEE Question 5 to complete this excel program assignment before closing and saving.) 2. The FED is concerned with interest rate levels and the possibility of inflation Given your assigned information for the June 2020 data below and January 2022, calculate the two annual forward rates using the information provided below for both periods. HOW have expectations changed? 3. Given the Spot rate and your two calculated forward rates for both periods, calculate the expected inflation premiums for each of the next three years based first on 2020 data, and then on the 2022 data. Assume the RR (real rate) = 2%. WHAT has changed among the expectations of inflation? 4. Given your numbers forecasted in 2020 and in 2022, should the FED be concerned with inflation (deflation) in the near term (first year), interim period (second year), or longer term (third year) period observed and calculated for 2020? For 2022? 5. Using Excel, draw the four yield curves (if possible on the same graph) reflective of 2010, 2012, 2020 and 2022-label each. (See Part Three Question 1 above.) What do you observe? How has the yield curve changed 2010 to 2012 to 2020 to 2022? What might the most recent change imply? Provide a clear interpretation. September 2010 Date 1 mo 3 mo 6 mo 1 yr 2 yr 3 yr 5 yr 7 yr 10 yr 20 yr 30 yr 09/29/10 0.12 0.16 0.20 0.27 0.44 0.87 1.28 1.91 2.52 3.38 3.89 January 2012 Date 1 mo 3 mo 6 mo 1 yr 2 yr 3 yr 5 yr 7 yr 10 yr 20 yr 30 yr 01/13/12 0.02 0.03 0.08 0.10 0.24 0.34 0.80 132 1.89 2.59 2.91 I
 Part Four-Problem: show all work Answer all five questions (5 points
each; 25 points total) 1. Create in excel (and submit by attaching
data set from 6/02/2020 until 9/05/2023 from daily treasury par yield curve rates

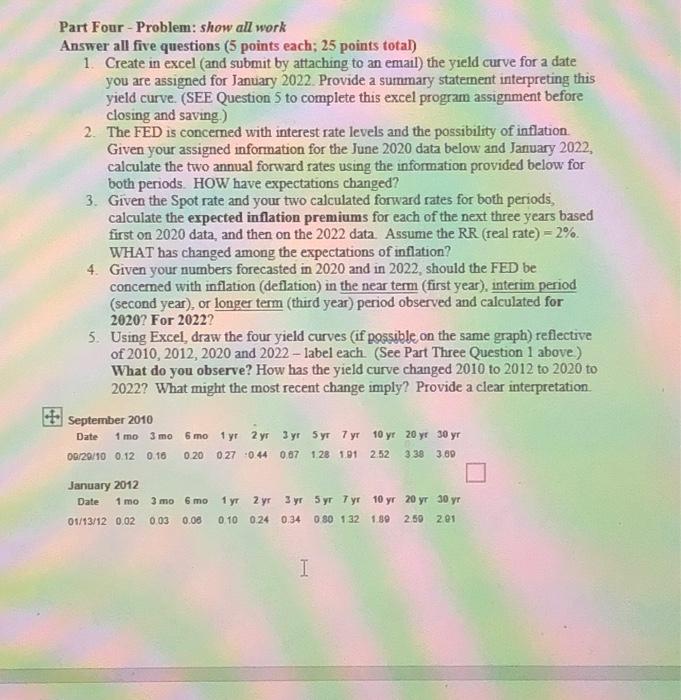
Part Four-Problem: show all work Answer all five questions ( 5 points each; 25 points total) 1. Create in excel (and submit by attaching to an email) the yield curve for a date you are assigned for January 2022 . Provide a summary statement interpreting this yield curve. (SEE Question 5 to complete this excel program assignment before closing and saving.) 2. The FED is concerned with interest rate levels and the possibility of inflation. Given your assigned information for the June 2020 data below and Jaruary 2022, calculate the two annual forward rates using the information provided below for both periods. HOW have expectations changed? 3. Given the Spot rate and your two calculated forward rates for both periods, calculate the expected inflation premiums for each of the next three years based first on 2020 data, and then on the 2022 data. Assume the RR (real rate) =2%. WHAT has changed among the expectations of inflation? 4. Given your numbers forecasted in 2020 and in 2022 , should the FED be concerned with inflation (deflation) in the near term (first year), interim period (second year), or longer term (third year) period observed and calculated for 2020? For 2022? 5. Using Excel, draw the four yield curves (if possible on the same graph) reflective of 2010, 2012, 2020 and 2022 - label each. (See Part Three Question 1 above) What do you observe? How has the yield curve changed 2010 to 2012 to 2020 to 2022? What might the most recent change imply? Provide a clear interpretation. 2020 data from FED web page Daily Treasury Par Yield Curve Rates

Step by Step Solution

There are 3 Steps involved in it

1 Expert Approved Answer
Step: 1 Unlock blur-text-image
Question Has Been Solved by an Expert!

Get step-by-step solutions from verified subject matter experts

Step: 2 Unlock
Step: 3 Unlock

Students Have Also Explored These Related Finance Questions!