

Question: Part H? How do I build a linear regression model? Load the data from the file auto-mpg.csv. The file contains information about various cars made
Part H? How do I build a linear regression model?
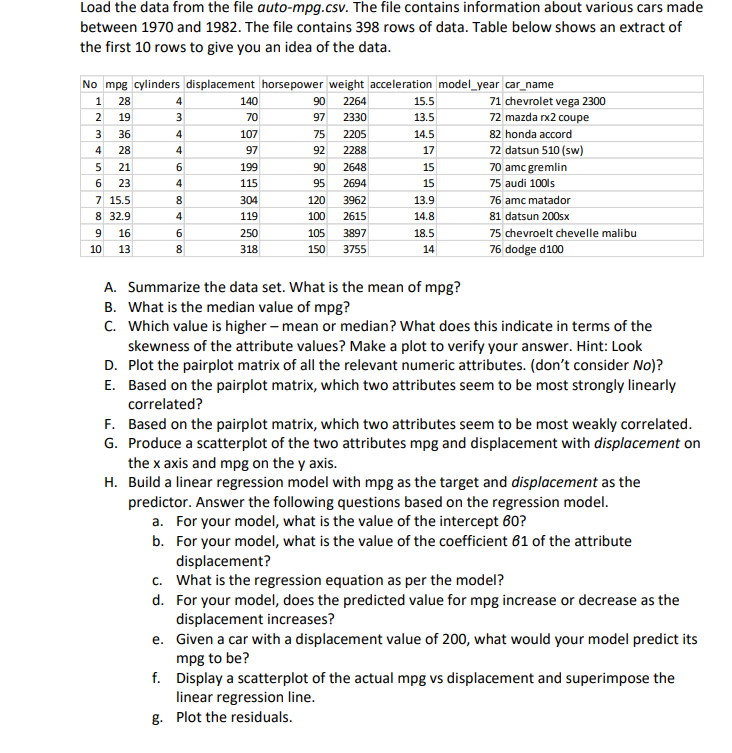
Load the data from the file auto-mpg.csv. The file contains information about various cars made between 1970 and 1982. The file contains 398 rows of data. Table below shows an extract of the first 10 rows to give you an idea of the data. No mpg cylinders displacement horsepower weight acceleration model_year car_name 1 28 140 90 2264 15.5 71 chevrolet vega 2300 19 70 97 2330 13.5 72 mazda rx2 coupe 3 36 4 107 75 2205 14.5 82 honda accord 4 28 97 92 2288 17 72 datsun 510 (sw) 5 21 6 199 90 2648 15 70 amc gremlin 6 23 4 115 95 2694 15 75 audi 1001s 7 15.5 304 120 3962 13.9 76 amc matador 8 32.9 119 100 2615 14.8 81 datsun 200sx 9 16 250 105 3897 18.5 75 chevroelt chevelle malibu 10 13 318 150 3755 14 76 dodge d100 A. Summarize the data set. What is the mean of mpg? B. What is the median value of mpg? C. Which value is higher - mean or median? What does this indicate in terms of the skewness of the attribute values? Make a plot to verify your answer. Hint: Look D. Plot the pairplot matrix of all the relevant numeric attributes. (don't consider No)? E. Based on the pairplot matrix, which two attributes seem to be most strongly linearly correlated? F. Based on the pairplot matrix, which two attributes seem to be most weakly correlated. G. Produce a scatterplot of the two attributes mpg and displacement with displacement on the x axis and mpg on the y axis. H. Build a linear regression model with mpg as the target and displacement as the predictor. Answer the following questions based on the regression model. a. For your model, what is the value of the intercept 60? b. For your model, what is the value of the coefficient 61 of the attribute displacement? c. What is the regression equation as per the model? d. For your model, does the predicted value for mpg increase or decrease as the displacement increases? e. Given a car with a displacement value of 200, what would your model predict its mpg to be? f. Display a scatterplot of the actual mpg vs displacement and superimpose the linear regression line. g. Plot the residuals
Step by Step Solution
There are 3 Steps involved in it

Get step-by-step solutions from verified subject matter experts