

Question: PART I. After analyzing video data from a drone, we identified the location of six different vehicles in video frames two seconds apart. The location
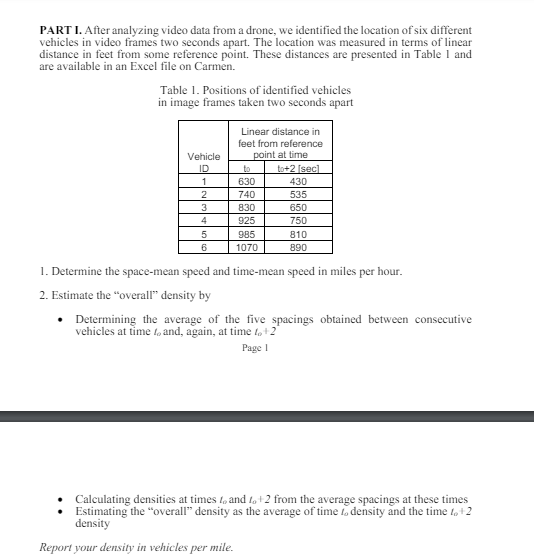
PART I. After analyzing video data from a drone, we identified the location of six different
vehicles in video frames two seconds apart. The location was measured in terms of linear
distance in feet from some reference point. These distances are presented in Table and
are available in an Excel file on Carmen.
Table Positions of identified vehicles
in image frames taken two seconds apart
Determine the spacemean speed and timemean speed in miles per hour.
Estimate the "overall" density by
Determining the average of the five spacings obtained between consecutive
vehicles at time and, again, at time
Page
Calculating densities at times and from the average spacings at these times
Estimating the "overall" density as the average of time density and the time
density
Report your density in vehicles per mile.
Step by Step Solution
There are 3 Steps involved in it
1 Expert Approved Answer
Step: 1 Unlock

Question Has Been Solved by an Expert!
Get step-by-step solutions from verified subject matter experts
Step: 2 Unlock
Step: 3 Unlock