

Question: Part I. Complete the statement below. 1. is a part of the graph that tells what it is all about. 2. In bar graph, is
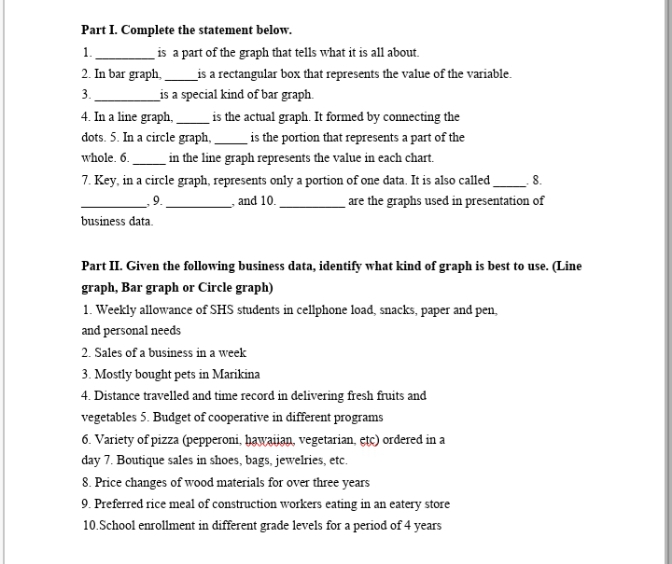
Part I. Complete the statement below. 1. is a part of the graph that tells what it is all about. 2. In bar graph, is a rectangular box that represents the value of the variable. 3. is a special kind of bar graph. 4. In a line graph, _ is the actual graph. It formed by connecting the dots. 5. In a circle graph, _ is the portion that represents a part of the whole. 6. in the line graph represents the value in each chart. 7. Key, in a circle graph, represents only a portion of one data. It is also called 8. , and 10. are the graphs used in presentation of business data. Part II. Given the following business data, identify what kind of graph is best to use. (Line graph, Bar graph or Circle graph) 1. Weekly allowance of SHS students in cellphone load, snacks, paper and pen, and personal needs 2. Sales of a business in a week 3. Mostly bought pets in Marikina 4. Distance travelled and time record in delivering fresh fruits and vegetables 5. Budget of cooperative in different programs 6. Variety of pizza (pepperoni, hawaiian, vegetarian, etc) ordered in a day 7. Boutique sales in shoes, bags, jewelries, etc. 8. Price changes of wood materials for over three years 9. Preferred rice meal of construction workers eating in an eatery store 10.School enrollment in different grade levels for a period of 4 years
Step by Step Solution
There are 3 Steps involved in it

Get step-by-step solutions from verified subject matter experts