

Question: Part I : Data Problems-SHOW ALL WORK!!! (Write response for each question. Then upload as a pdf file) 1) Macroeconomic Measurements Table 1 Year 1010
Part I:Data Problems-SHOW ALL WORK!!!
(Write response for each question. Then upload as a pdf file)
1)Macroeconomic Measurements
Table 1
Year 1010
Year 1020
Year 1030
Year 1040
Year 1050
Vulcan Nominal GDP
($ millions)
728.46816.74929.351012.211147.14Vulcan GDP deflator
(Base year 1035)
75.98083.31091.725101.996115.534
Given the information about the Vulcan economy in Table 1 (Show all work in context):
a) Calculate theReal GDPfor each year.
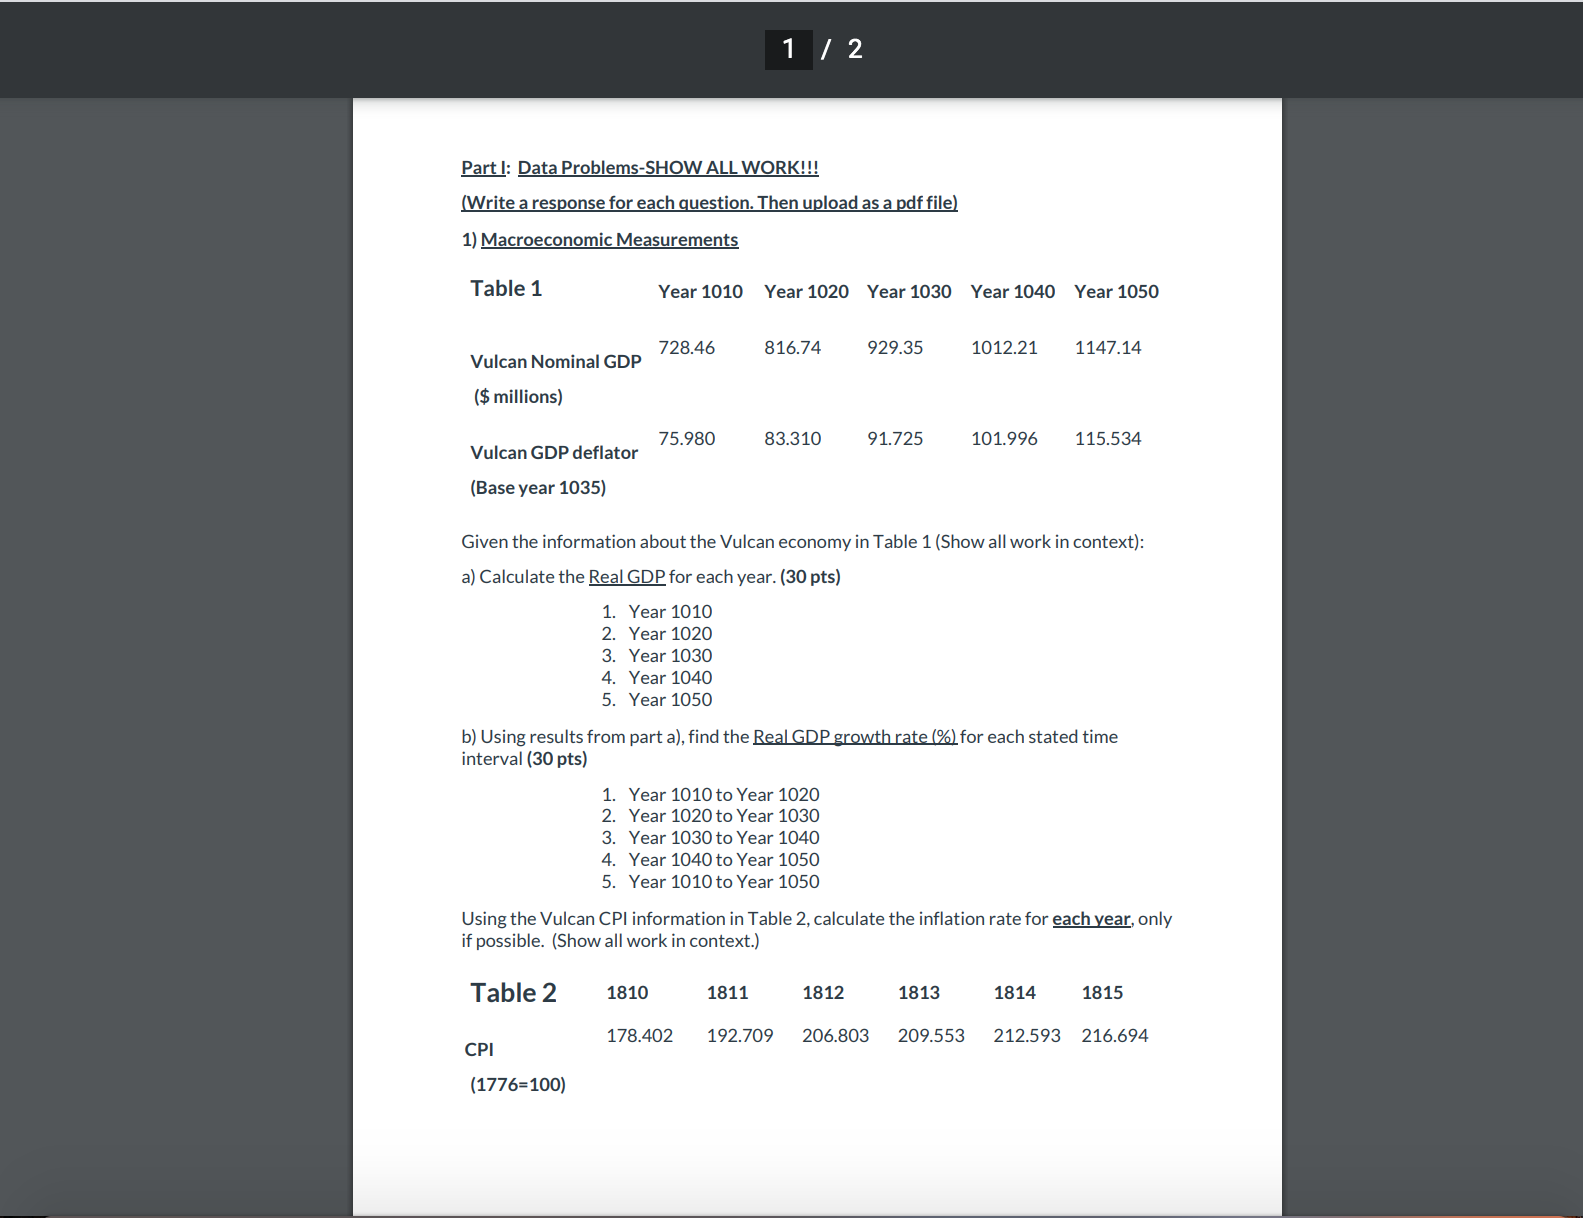
1 2 Part !: Data Problems-SHOW ALL WORK! (Write a response for each question. Then upload as a pdf file) 1) Macroeconomic Measurements Table 1 Year 1010 Year 1020 Year 1030 Year 1040 Year 1050 Vulcan Nominal GDP 728.46 816.74 929.35 1012.21 1147.14 ($ millions) Vulcan GDP deflator 75.980 83.310 91.725 101.996 115.534 (Base year 1035) Given the information about the Vulcan economy in Table 1 (Show all work in context): a) Calculate the Real GDP for each year. (30 pts) 1. Year 1010 2. Year 1020 3. Year 1030 4. Year 1040 5. Year 1050 b) Using results from part a), find the Real GDP growth rate (%) for each stated time interval (30 pts) 1. Year 1010 to Year 1020 2. Year 1020 to Year 1030 3. Year 1030 to Year 1040 4. Year 1040 to Year 1050 5. Year 1010 to Year 1050 Using the Vulcan CPI information in Table 2, calculate the inflation rate for each year, only if possible. (Show all work in context.) Table 2 1810 1811 1812 1813 1814 1815 CPI 178.402 192.709 206.803 209.553 212.593 216.694 (1776=100)
Step by Step Solution
There are 3 Steps involved in it

Get step-by-step solutions from verified subject matter experts