

Question: PART I: Network Diagram for a Project: begin { tabular } { | c | c | c | c | } hline
PART I:
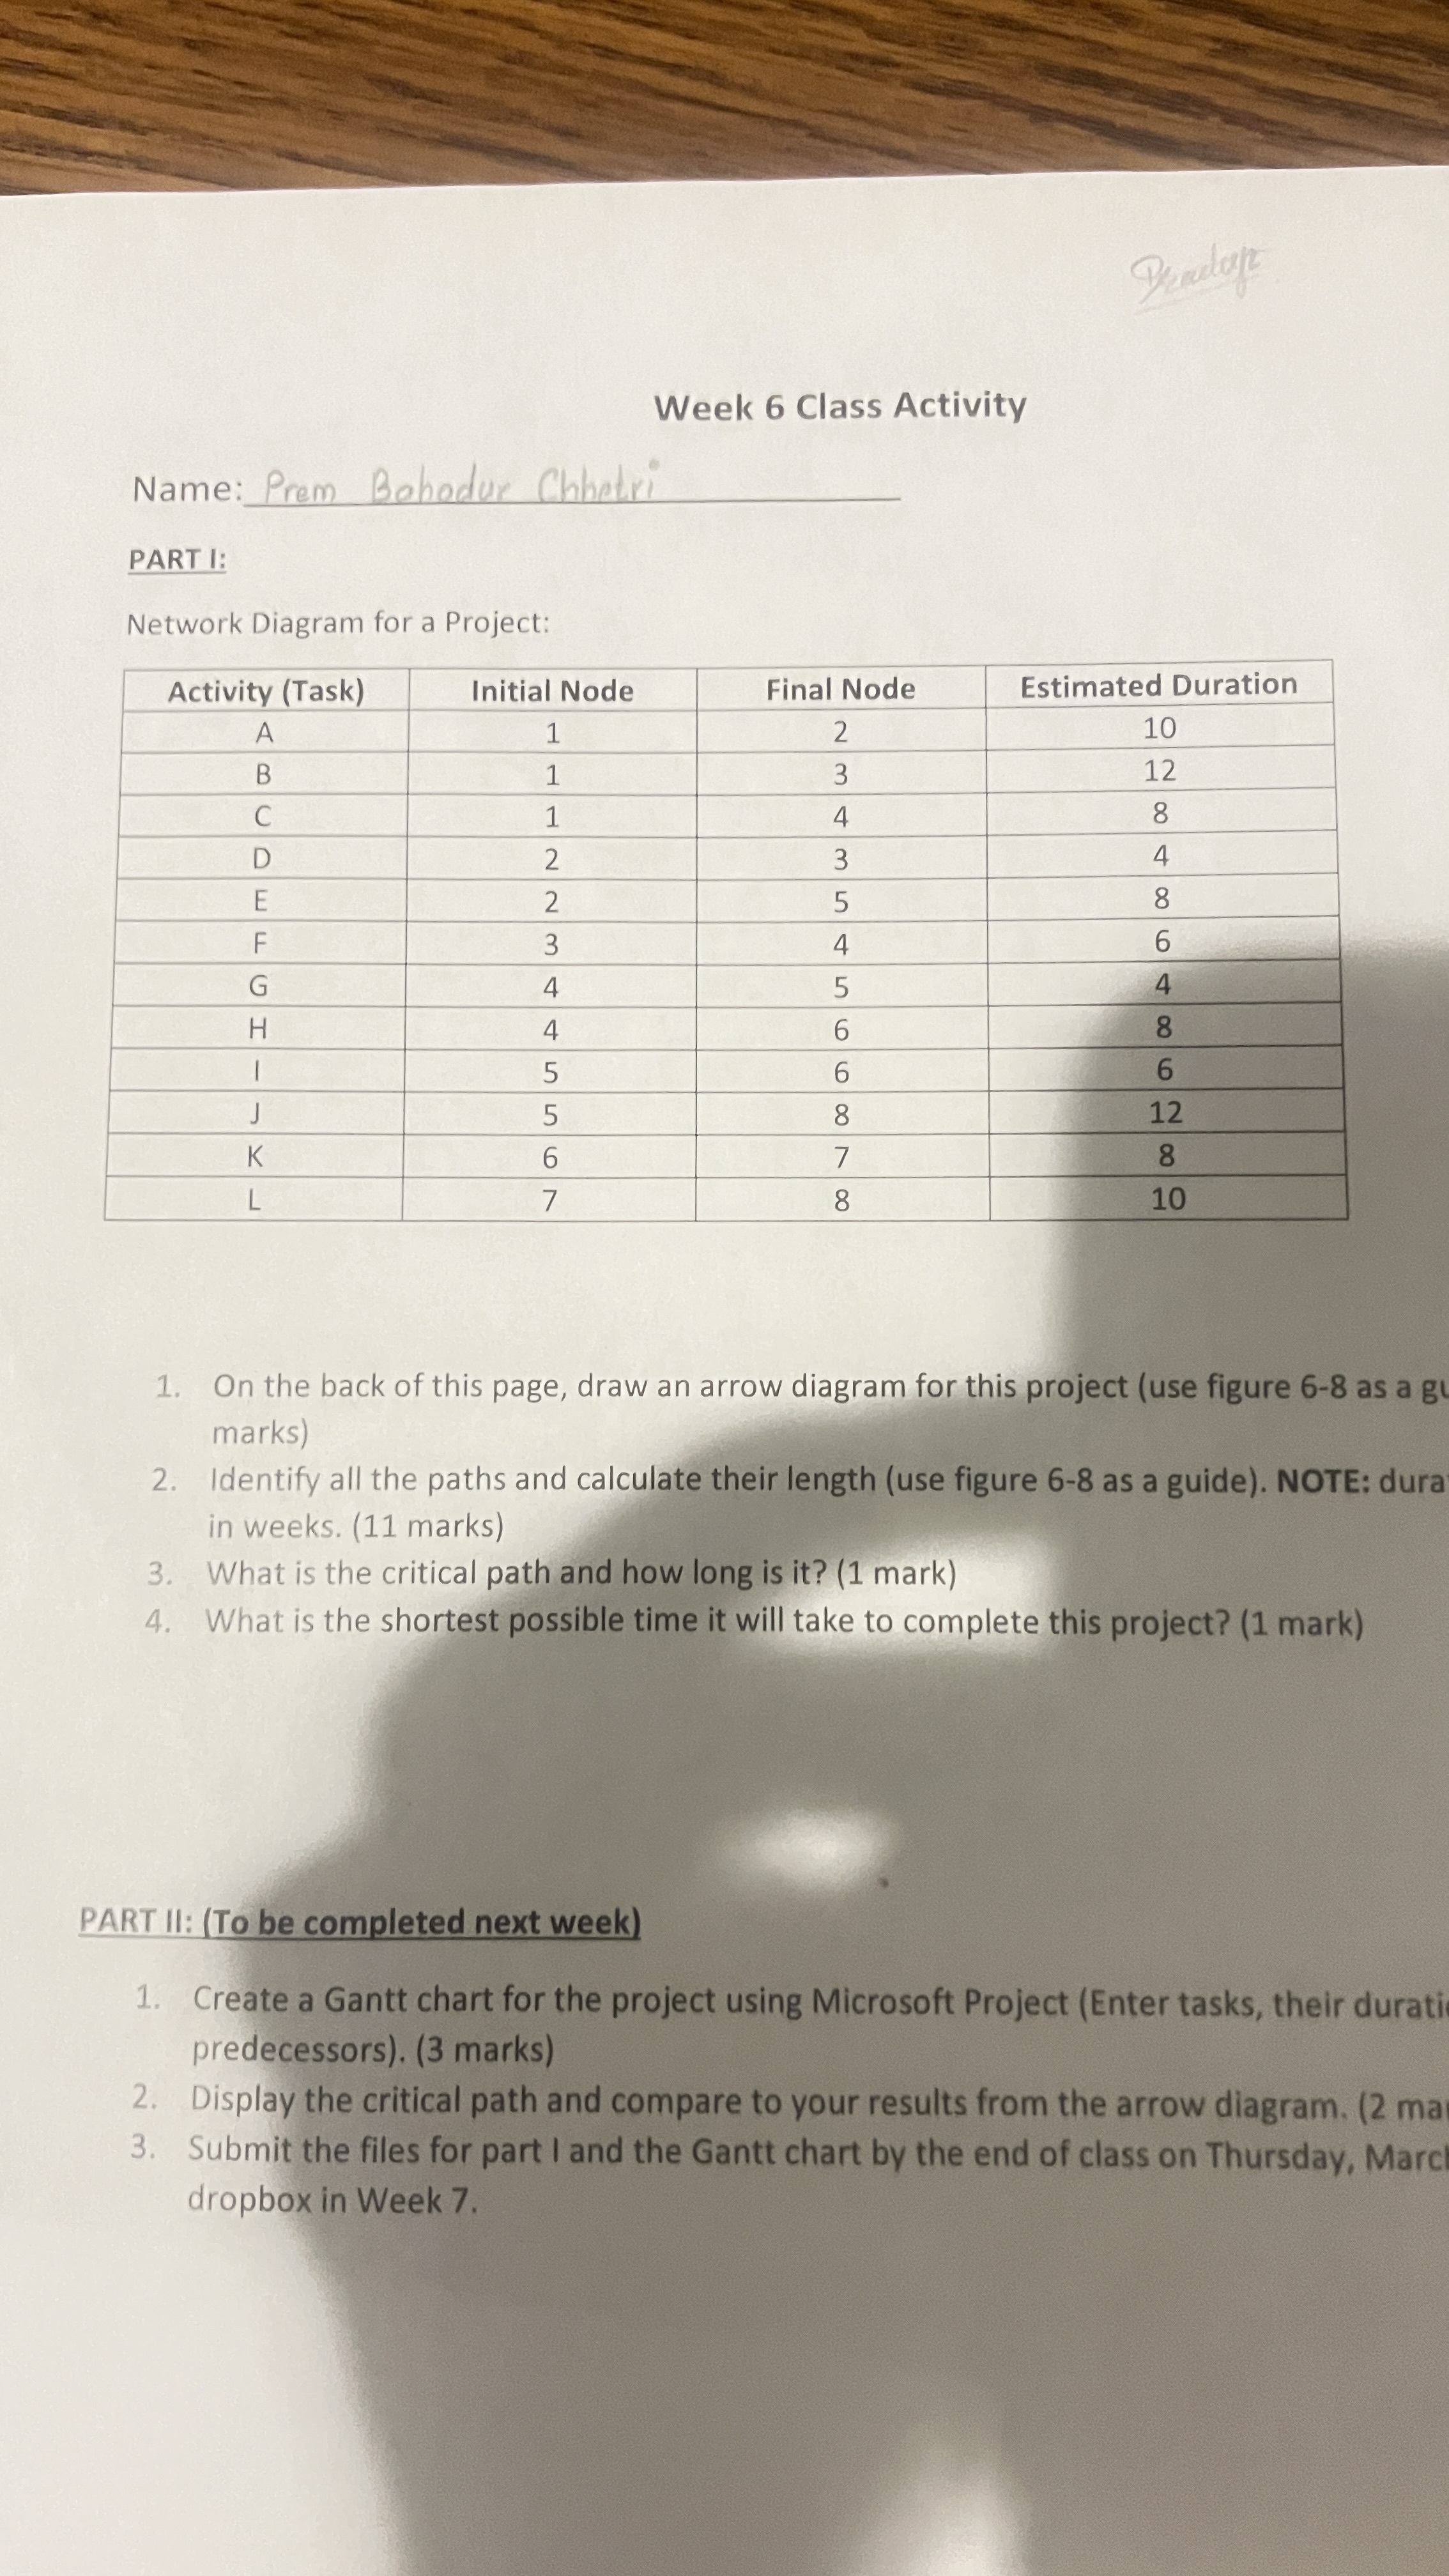
Network Diagram for a Project:
begintabularcccc
hline Activity Task & Initial Node & Final Node & Estimated Duration
hline A & & &
hline B & & &
hline C & & &
hline D & & &
hline F & & &
hline G & & &
hline H & & &
hline J & & &
hline K & & &
hline L & & &
hline
endtabular
On the back of this page, draw an arrow diagram for this project use figure as a gi marks
Identify all the paths and calculate their length use figure as a guide NOTE: dura in weeks. marks
What is the critical path and how long is it mark
What is the shortest possible time it will take to complete this project? mark
PART II: To be completed next week
Create a Gantt chart for the project using Microsoft Project Enter tasks, their durati predecessors marks
Display the critical path and compare to your results from the arrow diagram. mai
Submit the files for part I and the Gantt chart by the end of class on Thursday, Marcl dropbox in Week
Step by Step Solution
There are 3 Steps involved in it
1 Expert Approved Answer
Step: 1 Unlock

Question Has Been Solved by an Expert!
Get step-by-step solutions from verified subject matter experts
Step: 2 Unlock
Step: 3 Unlock