

Question: Part I Part I should be completed in both Excel and R. Note that it's natural to obtain different results depending on the software. However,
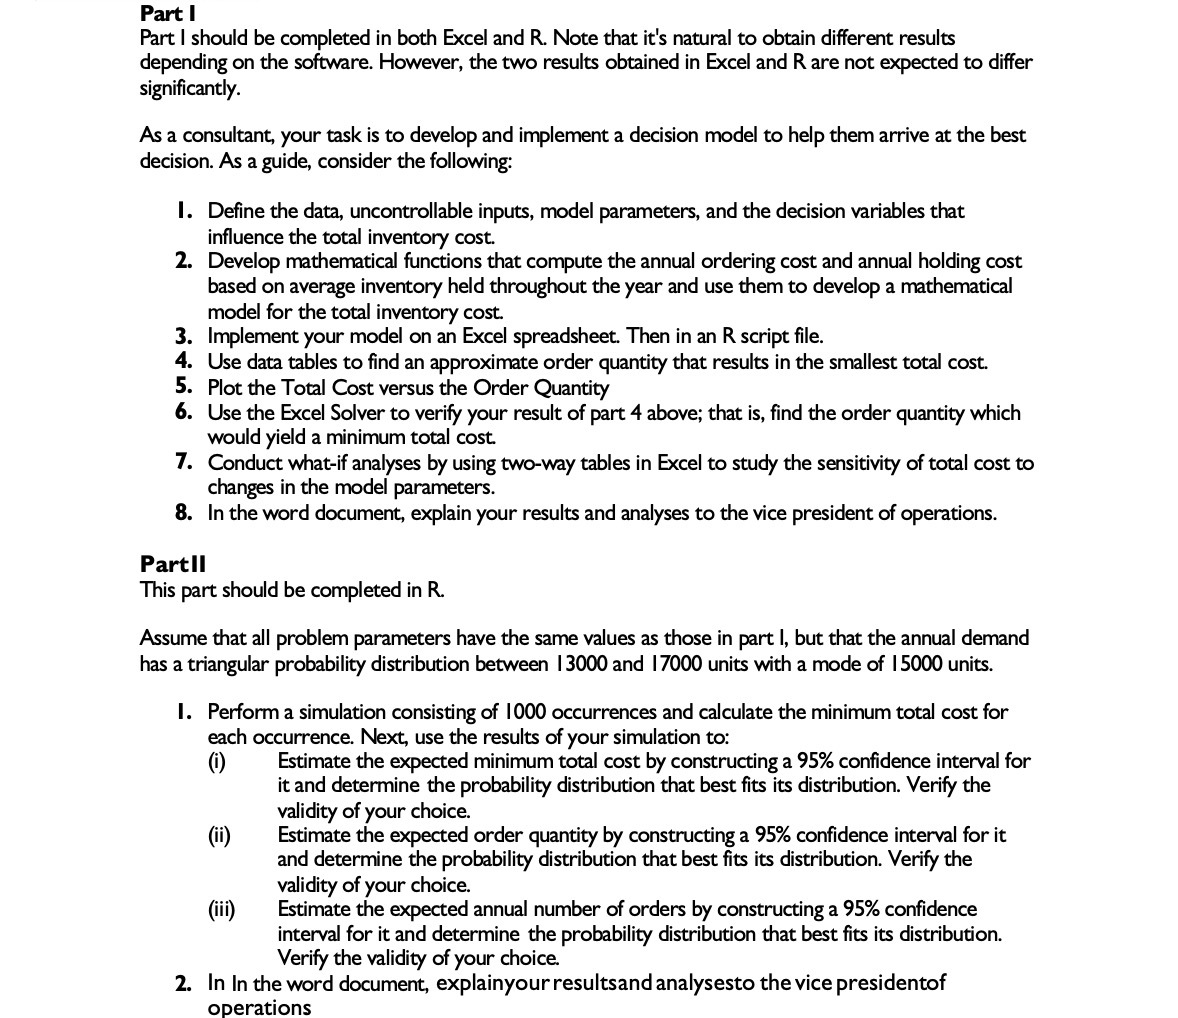
Part I Part I should be completed in both Excel and R. Note that it's natural to obtain different results depending on the software. However, the two results obtained in Excel and R are not expected to differ significantly. As a consultant, your task is to develop and implement a decision model to help them arrive at the best decision. As a guide, consider the following: I. Define the data, uncontrollable inputs, model parameters, and the decision variables that influence the total inventory cost. 2. Develop mathematical functions that compute the annual ordering cost and annual holding cost based on average inventory held throughout the year and use them to develop a mathematical model for the total inventory cost. 3. Implement your model on an Excel spreadsheet. Then in an R script file. 4. Use data tables to find an approximate order quantity that results in the smallest total cost. 5. Plot the Total Cost versus the Order Quantity 6. Use the Excel Solver to verify your result of part 4 above; that is, find the order quantity which would yield a minimum total cost. 7. Conduct what-if analyses by using two-way tables in Excel to study the sensitivity of total cost to changes in the model parameters. 8. In the word document, explain your results and analyses to the vice president of operations. Partll This part should be completed in R. Assume that all problem parameters have the same values as those in part I, but that the annual demand has a triangular probability distribution between 1 3000 and 17000 units with a mode of 1 5000 units. 1. Perform a simulation consisting of 1000 occurrences and calculate the minimum total cost for each occurrence. Next, use the results of your simulation to: (i) Estimate the expected minimum total cost by constructing a 95% confidence interval for it and determine the probability distribution that best fits its distribution. Verify the validity of your choice. (ii) Estimate the expected order quantity by constructing a 95% confidence interval for it and determine the probability distribution that best fits its distribution. Verify the validity of your choice. (iii) Estimate the expected annual number of orders by constructing a 95% confidence interval for it and determine the probability distribution that best fits its distribution. Verify the validity of your choice. 2. In In the word document, explainyour resultsand analysesto the vice presidentof operations
Step by Step Solution
There are 3 Steps involved in it

Get step-by-step solutions from verified subject matter experts