

Question: Part I Use an aggregate supply and demand chart to show the effect on GDP and CPI of each headline 1 . Government increases spending

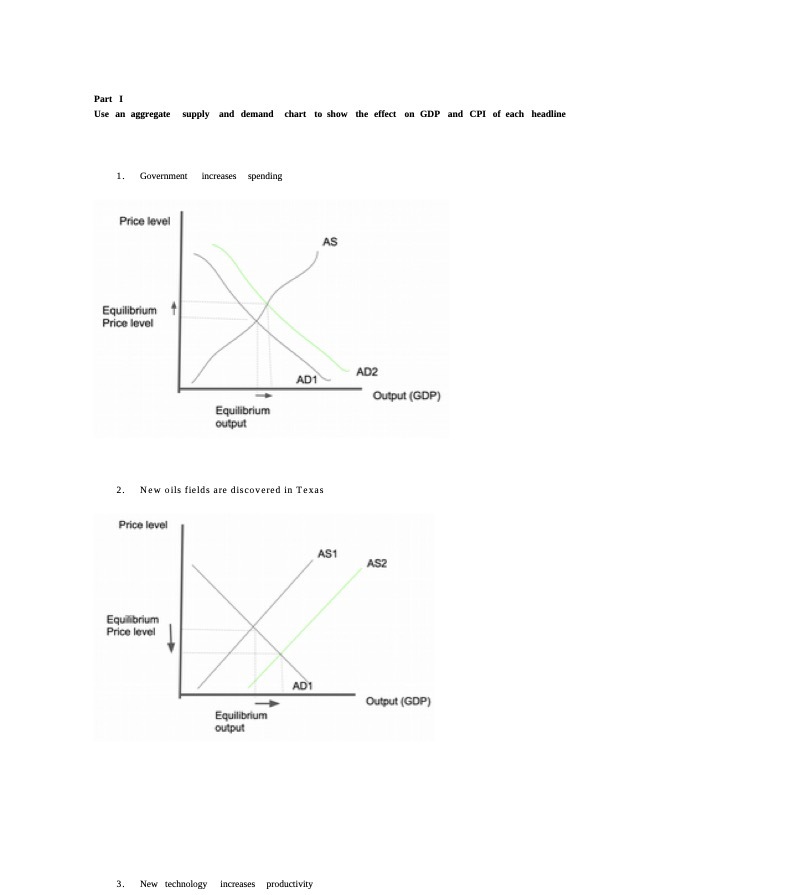
Part I Use an aggregate supply and demand chart to show the effect on GDP and CPI of each headline 1 . Government increases spending Price level AS Equilibrium Price level AD2 AD1 Output (GDP) Equilibrium output . New oils fields are discovered in Texas Price level AS1 AS2 Equilibrium Price level AD1 Output (GDP) Equilibrium output 3. New technology increases productivity
Step by Step Solution
There are 3 Steps involved in it
1 Expert Approved Answer
Step: 1 Unlock

Question Has Been Solved by an Expert!
Get step-by-step solutions from verified subject matter experts
Step: 2 Unlock
Step: 3 Unlock