

Question: PART II: For the same data from 2.8, do z-score normalization (see Lecture 2: Mean Absolute Deviation approach) for each feature dimension (A1 and A2,
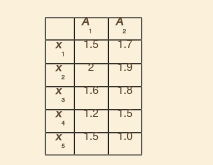
PART II: For the same data from 2.8, do z-score normalization (see Lecture 2: Mean Absolute Deviation approach) for each feature dimension (A1 and A2, respectively). Please include the new point x(1.4, 1.6) in the calculation of mean and mean absolute deviation. Use Euclidean distance on the normalized data to rank the data points in the ascending order of their distance values. (10 pts for getting the z-scores correctly, and 10 points for getting the rank correctly.)
Data and lecture are the following:
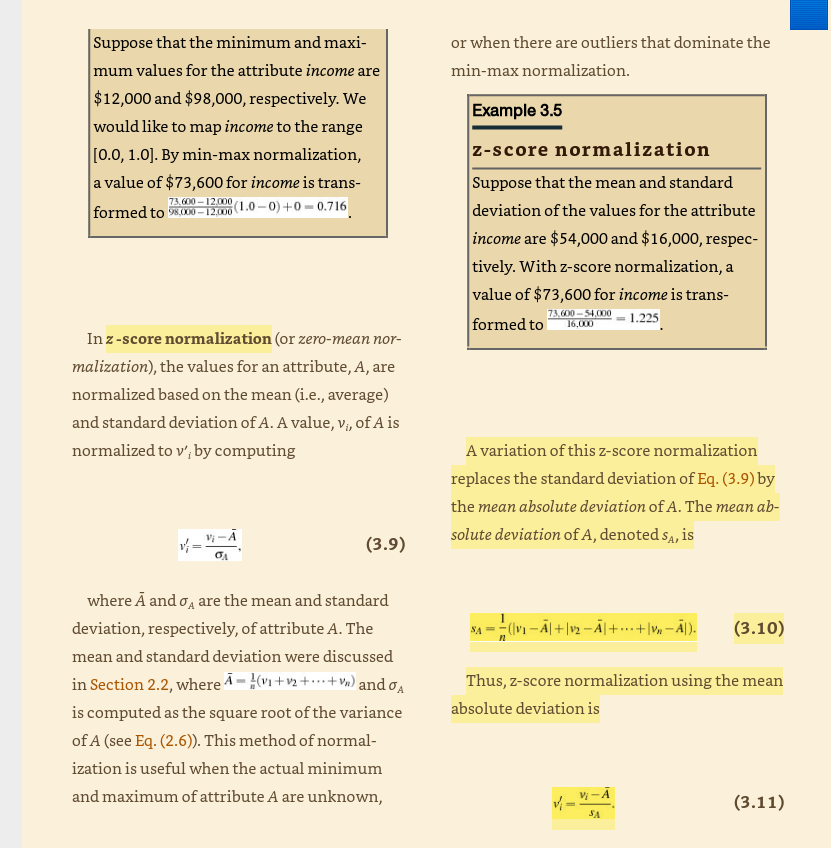
A 1.5 1 2 2 1.9 1.6 .8 4 1.2 3 or when there are outliers that dominate the min-max normalization. Example 3.5 Suppose that the minimum and maxi- mum values for the attribute income are $12,000 and $98,000, respectively. We would like to map income to the range (0.0, 1.0). By min-max normalization, a value of $73,600 for income is trans- formed to 98,000 - 12.000 (1.0-0)+0 -0.716 73.600 - 12.000 z-score normalization Suppose that the mean and standard deviation of the values for the attribute income are $54,000 and $16,000, respec- tively. With z-score normalization, a value of $73,600 for income is trans- formed to 1.225 73.600 -54,000 16.000 In z-score normalization (or zero-mean nor- malization), the values for an attribute, A, are normalized based on the mean (i.e., average) and standard deviation of A. A value, v, of A is normalized to v', by computing A variation of this z-score normalization replaces the standard deviation of Eq. (3.9) by the mean absolute deviation of A. The mean ab- solute deviation of A, denoted sa, is vi- A (3.9) SA (IV - | +|v2 - A[+...+|-AD). (3.10) where A and o are the mean and standard deviation, respectively, of attribute A. The mean and standard deviation were discussed in Section 2.2, where . - ?(0+2 +++* + ) and on is computed as the square root of the variance of A (see Eq. (2.6)). This method of normal- ization is useful when the actual minimum and maximum of attribute A are unknown, Thus, Z-score normalization using the mean absolute deviation is v;-A (3.11) SA A 1.5 1 2 2 1.9 1.6 .8 4 1.2 3 or when there are outliers that dominate the min-max normalization. Example 3.5 Suppose that the minimum and maxi- mum values for the attribute income are $12,000 and $98,000, respectively. We would like to map income to the range (0.0, 1.0). By min-max normalization, a value of $73,600 for income is trans- formed to 98,000 - 12.000 (1.0-0)+0 -0.716 73.600 - 12.000 z-score normalization Suppose that the mean and standard deviation of the values for the attribute income are $54,000 and $16,000, respec- tively. With z-score normalization, a value of $73,600 for income is trans- formed to 1.225 73.600 -54,000 16.000 In z-score normalization (or zero-mean nor- malization), the values for an attribute, A, are normalized based on the mean (i.e., average) and standard deviation of A. A value, v, of A is normalized to v', by computing A variation of this z-score normalization replaces the standard deviation of Eq. (3.9) by the mean absolute deviation of A. The mean ab- solute deviation of A, denoted sa, is vi- A (3.9) SA (IV - | +|v2 - A[+...+|-AD). (3.10) where A and o are the mean and standard deviation, respectively, of attribute A. The mean and standard deviation were discussed in Section 2.2, where . - ?(0+2 +++* + ) and on is computed as the square root of the variance of A (see Eq. (2.6)). This method of normal- ization is useful when the actual minimum and maximum of attribute A are unknown, Thus, Z-score normalization using the mean absolute deviation is v;-A (3.11) SA
Step by Step Solution
There are 3 Steps involved in it

Get step-by-step solutions from verified subject matter experts