

Question: Part II: Maximum Power Transfer Question ( 2 ) : a . Using the network shown in Figure 2 . 1 , create the diagram
Part II: Maximum Power Transfer
Question :
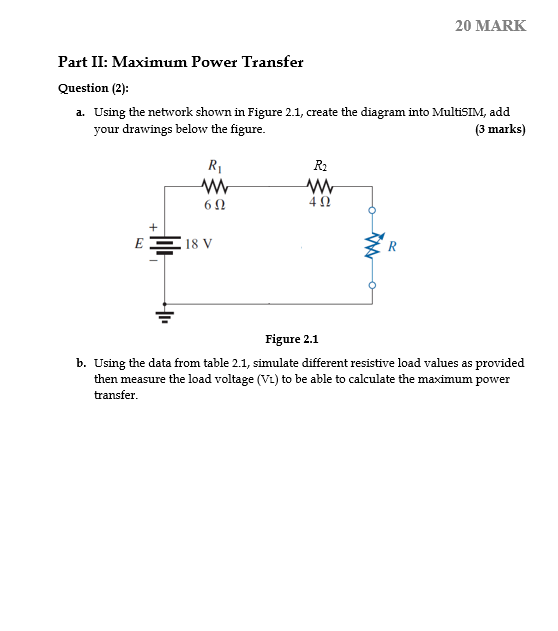
a Using the network shown in Figure create the diagram into MultisIM, add your drawings below the figure.
b Using the data from table simulate different resistive load values as provided then measure the load voltage mathrmVL to be able to calculate the maximum power transfer.
MARK
Date Table
Marks
tableRVLOmega Omega Omega Omega Omega Omega Omega Omega Omega Omega Omega Omega Omega
c Use graph to determine each cross point of your answers in table then draw a line of the differences between the load resistance and maximum power.
Marks
Ptext Max w
Conclusion
Write your conclusion to explain what you've done and experienced from this assignment.
Step by Step Solution
There are 3 Steps involved in it
1 Expert Approved Answer
Step: 1 Unlock

Question Has Been Solved by an Expert!
Get step-by-step solutions from verified subject matter experts
Step: 2 Unlock
Step: 3 Unlock