

Question: Part II. The data in the table and plotted in te chart are for government bond yields last October. Use these data to answer the
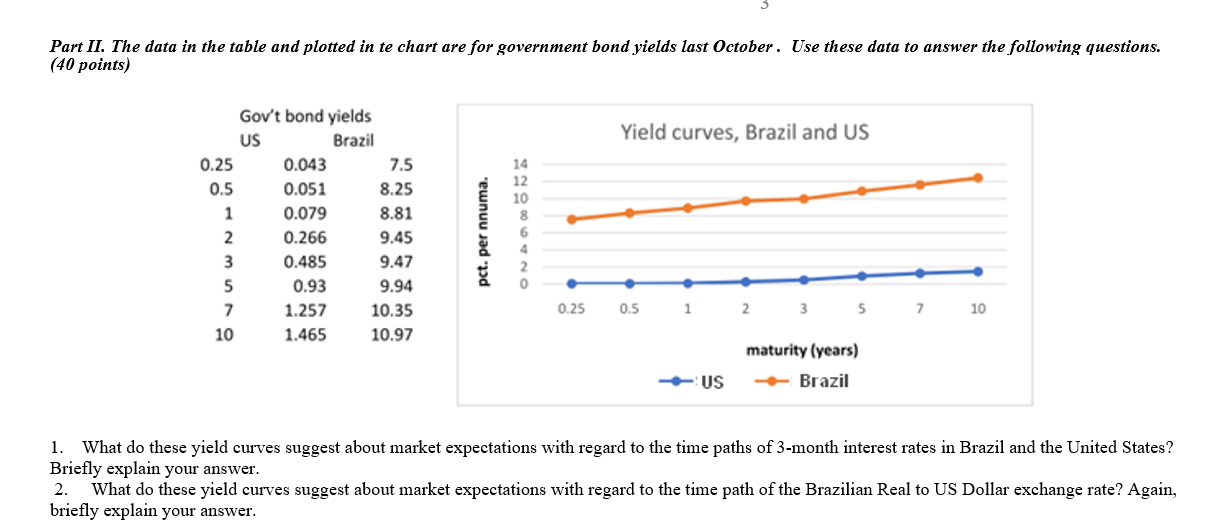
Part II. The data in the table and plotted in te chart are for government bond yields last October. Use these data to answer the following questions. (40 points) Yield curves, Brazil and US Gov't bond yields US Brazil 0.25 0.043 7.5 0.5 0.051 8.25 1 0.079 8.81 2 0.266 9.45 3 0.485 9.47 5 0.93 9.94 7 1.257 10.35 10 1.465 10.97 pct. per nnuma. 14 12 10 8 6 2 0 . 0.25 0.5 1 2 35 7 10 maturity (years) Brazil -US 1. What do these yield curves suggest about market expectations with regard to the time paths of 3-month interest rates in Brazil and the United States? Briefly explain your answer. 2. What do these yield curves suggest about market expectations with regard to the time path of the Brazilian Real to US Dollar exchange rate? Again, briefly explain your
Step by Step Solution
There are 3 Steps involved in it

Get step-by-step solutions from verified subject matter experts