

Question: Part IIComputing World Marts Share Value Using Free Cash Flows to All Debt and Equity Stakeholders (FCFA) a. Beginning with projected net cash flows from
Part IIComputing World Marts Share Value Using Free Cash Flows to All Debt and Equity Stakeholders (FCFA)
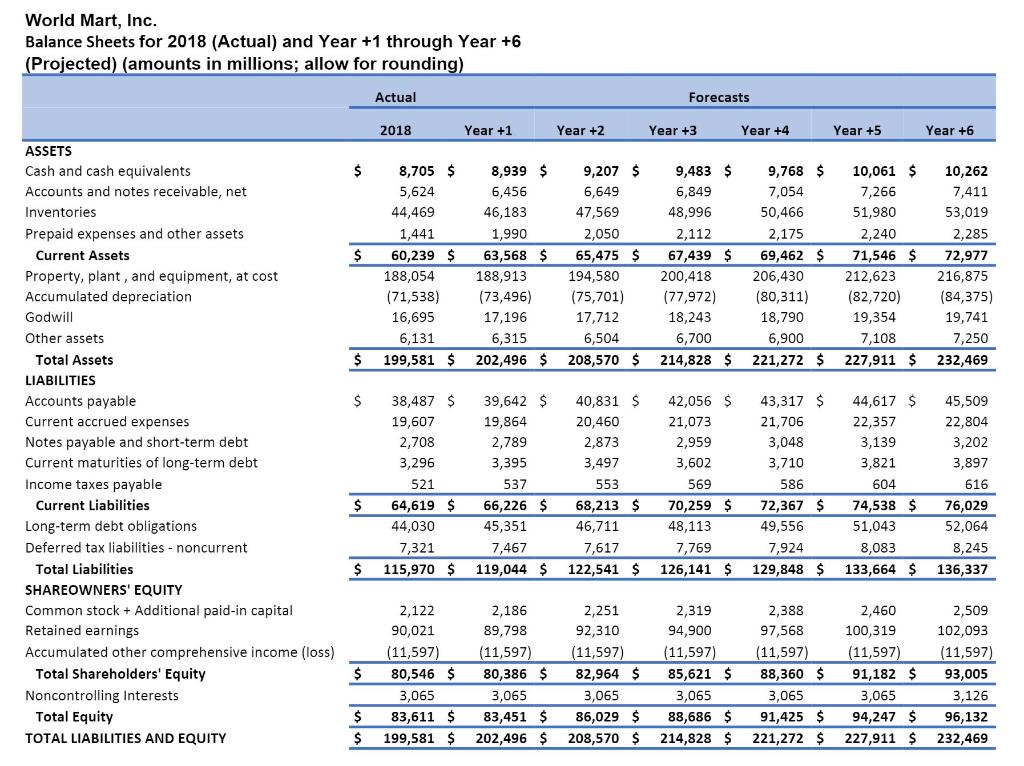
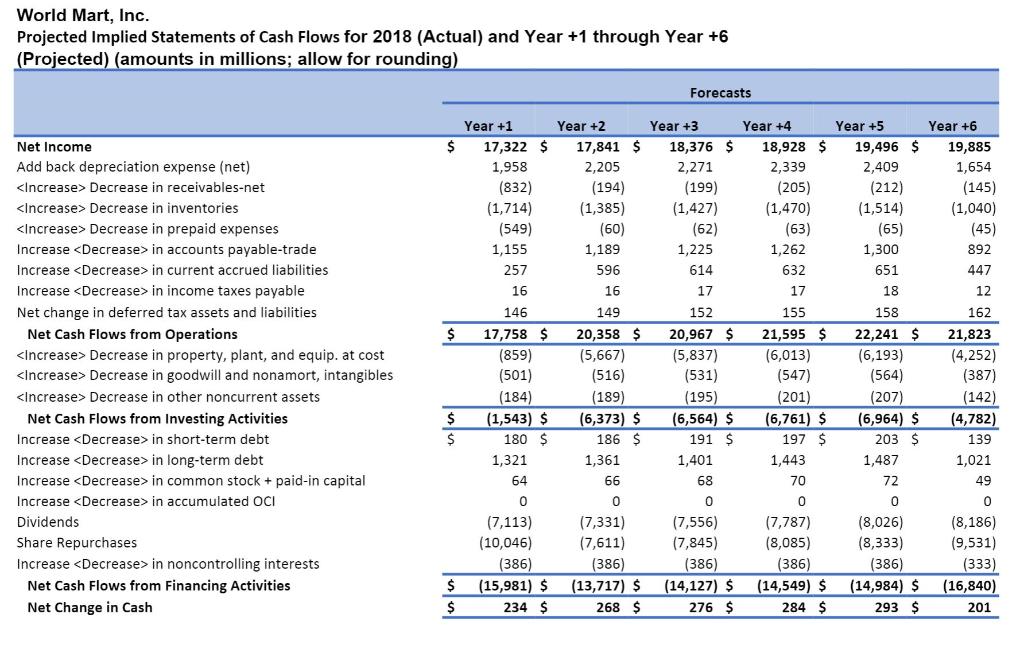
a. Beginning with projected net cash flows from operations, derive the projected free cash flows for all debt and equity stakeholders for World-Mart for Years +1 through +6 based on the projected financial statements. Assume that the change in cash each year is related to operating liquidity needs. Assume that all financial assets are part of the firms operating capital.
b. Using the appropriate required rate of return from Question (1) as a discount rate, compute the sum of the present value of free cash flows for all debt and equity stakeholders for World-Mart for Years +1 through +5.
c. Using the appropriate required rate of return from Qestion (1) as a discount rate and the long-run growth rate of 2.0%, compute the continuing value of World-Mart as of the start of Year +6 based on World-Marts continuing free cash flows for all debt and equity stakeholders in Year +6 and beyond. After computing continuing value as of the start of Year +6, discount it to present value as of the start of Year +1.
d. Compute the value of a share of World-Mart common stock, as follows:
1. Compute the total value of World-Marts net operating assets using the total sum of the present value of free cash flows for all debt and equity stakeholders.
2. Subtract the value of outstanding debt and the value of the non-controlling interests to obtain the value of equity.
3. Adjust the sum of the present value using the midyear discounting adjustment factor.
4. Compute the per-share value estimate of World-Marts common equity shares.
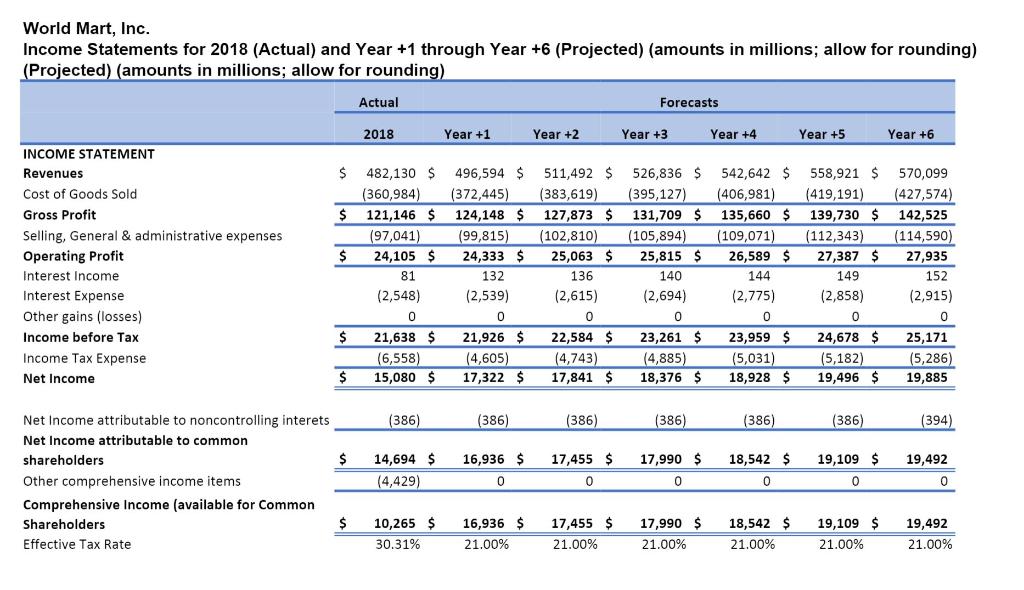
World Mart, Inc. Income Statements for 2018 (Actual) and Year +1 through Year +6 (Projected) (amounts in millions; allow for rounding) (Projected) (amounts in millions; allow for rounding) Actual Forecasts 2018 Year +1 Year +2 Year +3 Year +4 Year +5 Year +6 $ $ $ INCOME STATEMENT Revenues Cost of Goods Sold Gross Profit Selling, General & administrative expenses Operating Profit Interest Income Interest Expense Other gains (losses) Income before Tax Income Tax Expense Net Income 482,130 $ (360,984) 121,146 $ (97,041) 24,105 $ 81 (2,548) 0 21,638 $ (6,558) 15,080 $ 496,594 $ (372,445) 124,148 $ (99,815) 24,333 $ 132 (2,539) 0 21,926 $ (4,605) 17,322 $ 511,492 $ (383,619) 127,873 $ (102,810) 25,063 $ 136 (2,615) 0 22,584 $ (4,743) 17,841 $ 526,836 $ (395,127) 131,709 $ (105,894) 25,815 $ 140 (2,694) 0 23,261 $ (4,885) 18,376 $ 542,642 $ (406,981) 135,660 $ (109,071) 26,589 $ 144 (2,775) 0 23,959 $ (5,031) 18,928 $ 558,921 $ (419,191) 139,730 $ (112,343) 27,387 $ 149 (2,858) 0 24,678 $ (5,182) 19,496 $ 570,099 (427,574) 142,525 (114,590) 27,935 152 (2,915) 0 25,171 (5,286) 19,885 $ $ (386) (386) (386) (386) (386) (386) (394) $ 16,936 $ 17,455 $ 17,990 $ 18,542 $ 19,492 Net Income attributable to noncontrolling interets Net Income attributable to common shareholders Other comprehensive income items Comprehensive Income (available for Common Shareholders Effective Tax Rate 14,694 $ (4,429) 19,109 $ 0 0 0 0 $ 10,265 $ 30.31% 16,936 $ 21.00% 17,455 $ 21.00% 17,990 $ 21.00% 18,542 $ 21.00% 19,109 $ 21.00% 19,492 21.00% World Mart, Inc. Balance Sheets for 2018 (Actual) and Year +1 through Year +6 (Projected) (amounts in millions; allow for rounding) Actual Forecasts 2018 Year +1 Year +2 Year +3 Year +4 Year +5 Year +6 $ $ 8,705 $ 5,624 44,469 1,441 60,239 $ 188,054 (71,538) 16,695 6,131 199,581 $ 8,939 $ 6,456 46,183 1,990 63,568 $ 188,913 (73,496) 17,196 6,315 202,496 $ 9,207 $ 6,649 47,569 2,050 65,475 $ 194,580 (75,701) 17,712 6,504 208,570 $ 9,483 $ 6,849 48,996 2,112 67,439 $ 200,418 (77,972) 18,243 6,700 214,828 $ 9,768 $ 7,054 50,466 2,175 69,462 $ 206,430 (80,311) 18,790 6,900 221,272 $ 10,061 $ 7,266 51,980 2,240 71,546 $ 212,623 (82,720) 19,354 7,108 227,911 $ 10,262 7,411 53,019 2,285 72,977 216,875 (84,375) 19,741 7,250 232,469 $ $ ASSETS Cash and cash equivalents Accounts and notes receivable, net Inventories Prepaid expenses and other assets Current Assets Property, plant, and equipment, at cost Accumulated depreciation Godwill Other assets Total Assets LIABILITIES Accounts payable Current accrued expenses Notes payable and short-term debt Current aturities long-term debt Income taxes payable Current Liabilities Long-term debt obligations Deferred tax liabilities - noncurrent Total Liabilities SHAREOWNERS' EQUITY Common stock + Additional paid-in capital Retained earnings Accumulated other comprehensive income (loss) Total Shareholders' Equity Noncontrolling Interests Total Equity TOTAL LIABILITIES AND EQUITY 38,487 $ 19,607 2,708 3,296 521 64,619 $ 44,030 7,321 115,970 $ 39,642 $ 19,864 2,789 3,395 537 66,226 $ 45,351 7,467 119,044 $ 40,831 $ 20,460 2,873 3,497 553 68,213 $ 46,711 7,617 122,541 $ 42,056 $ 21,073 2,959 3,602 569 70,259 $ 48,113 7,769 126,141 $ 43,317 $ 21,706 3,048 3,710 586 72,367 $ 49,556 7,924 129,848 $ 44,617 $ 45,509 22,357 22,804 3,139 3,202 3,821 3,897 604 616 74,538 $ 76,029 51,043 52,064 8,083 8,245 133,664 $ 136,337 $ $ $ 2,122 90,021 (11,597) 80,546 $ 3,065 83,611 $ 199,581 $ 2,186 89,798 (11,597) 80,386 $ 3,065 83,451 $ 202,496 $ 2,251 92,310 (11,597) 82,964 $ 3,065 86,029 $ 208,570 $ 2,319 94,900 (11,597) 85,621 $ 3,065 88,686 $ 214,828 $ 2,388 97,568 (11,597) 88,360 $ 3,065 91,425 $ 221,272 $ 2,460 100,319 (11,597) 91,182 $ 3,065 94,247 $ 227,911 $ 2,509 102,093 (11,597) 93,005 3,126 96,132 232,469 $ $ World Mart, Inc. Projected Implied Statements of Cash Flows for 2018 (Actual) and Year +1 through Year +6 (Projected) (amounts in millions; allow for rounding) Forecasts $ Year +1 17,322 $ 1,958 (832) (1,714) (549) 1,155 257 Year +5 19,496 $ 2,409 (212) (1,514) (65) 1,300 651 18 158 22,241 $ (6,193) 16 Year +3 18,376 $ 2,271 (199) (1,427) (62) 1,225 614 17 152 20,967 $ (5,837) (531) (195) (6,564) $ 191 $ 1,401 68 Net Income Add back depreciation expense (net)
Step by Step Solution
There are 3 Steps involved in it

Get step-by-step solutions from verified subject matter experts