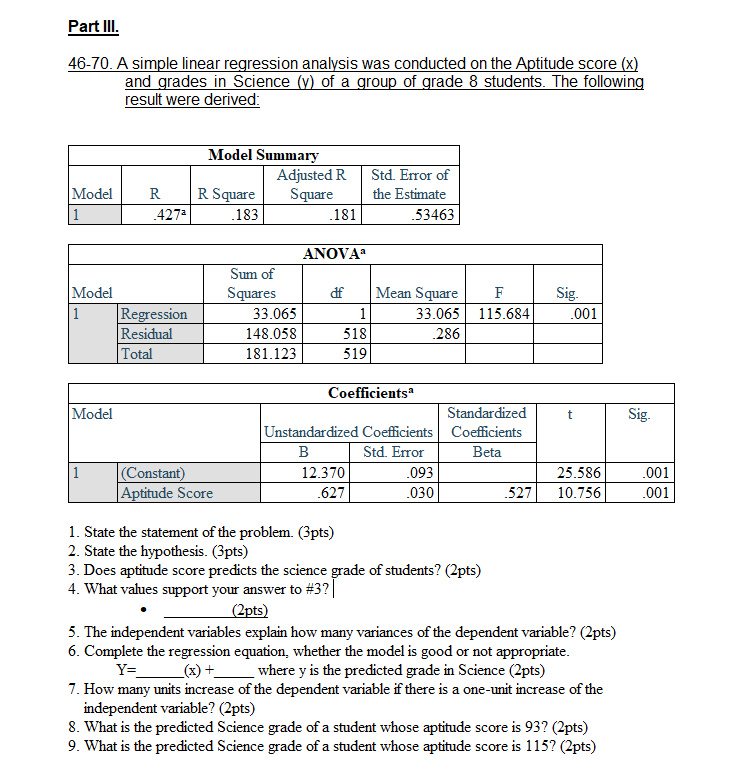
Question: Part III. 46-70. A simple linear regression analysis was conducted on the Aptitude score (x) and grades in Science (y) of a group of grade

Part III. 46-70. A simple linear regression
Part III. 46-70. A simple linear regression analysis was conducted on the Aptitude score (x) and grades in Science (y) of a group of grade 8 students. The following result were derived: Model Summary Adjusted R Std. Error of Model R R Square Square the Estimate 427 183 181 53463 ANOVA Sum of Model Squares if Mean Square F Sig Regression 33.065 1 33.065 115.684 001 Residual 148.058 518 286 Total 181.123 519 Coefficients Model Standardized t Sig Unstandardized Coefficients Coefficients B Std. Error Beta 1 (Constant) 12.370 093 25.586 001 Aptitude Score 627 030 527 10.756 001 1. State the statement of the problem. (3pts) 2. State the hypothesis. (3pts) 3. Does aptitude score predicts the science grade of students? (2pts) 4. What values support your answer to #3? | (2pts) 5. The independent variables explain how many variances of the dependent variable? (2pts) 6. Complete the regression equation, whether the model is good or not appropriate. Y= (x ) +_ where y is the predicted grade in Science (2pts) 7. How many units increase of the dependent variable if there is a one-unit increase of the independent variable? (2pts) 8. What is the predicted Science grade of a student whose aptitude score is 93? (2pts) 9. What is the predicted Science grade of a student whose aptitude score is 115? (2pts)

Step by Step Solution

There are 3 Steps involved in it

1 Expert Approved Answer
Step: 1 Unlock blur-text-image
Question Has Been Solved by an Expert!

Get step-by-step solutions from verified subject matter experts

Step: 2 Unlock
Step: 3 Unlock

Students Have Also Explored These Related Mathematics Questions!