

Part of your job as a data analyst will be to find information on the web, clean
Question:
Part of your job as a data analyst will be to find information on the web, clean it and present the data in a meaningful format other people can understand. In this assignment, you are going to do is with a tourism dataset from the world bank. You will download the data, clean it and then make a function which will allow a user to input a variable number of countries and years, and the output will be a graph of the countries vs years. This assignment directly maps to the following learning outcomes:
- Utilize the R programming language to write functions, loops, examine and explore data and utilize libraries for added functionality for data analysis such as: dplyr, ggplot2, lubridate, and tidyr.
- Demonstrate how to turn unstructured data (messy data) into structured data (tidy data).
- Demonstrate how to search for online databases, find open data sources on the internet, and utilize the data.
- Retrieve data from the web, clean it, and present the data to a user in a readable, often visual, format which utilizes tools and techniques learned throughout the course.
Directions
- Download the dataset from:
http://data.worldbank.org/indicator/ST.INT.RCPT.CD
- Unzip the file and load it into R Studio
- You can use read.csv(), or read.xls() from library(xlsx)
- Clean & Tidy the data
- Note: you need to convert data from data wide to data long.
- Plot out graph of 3 countries tourism $ vs time
- You need to use ggplot() for this part of the problem. If you use another plotting function ie. plot() or qplot() you will only received 50% credit for this part of the assignment.
- Convert your y-axis a log axis.
- Make a function by wrapping your code with a function argument
- Your arguments should be three countries
- Extra Credit part 1 - Use the ". . ." argument to pass multiple countries and multiple years in the function. This will allow the user to plot as many countries and for whatever years they want.
- Credit part 2 - create an argument that allows you to select a sequential number of years. So from 1997:2005
- Save the code as a . R file or a . Rmd file and upload the file to moodle
Note: You R code function and plot should look like the next page.
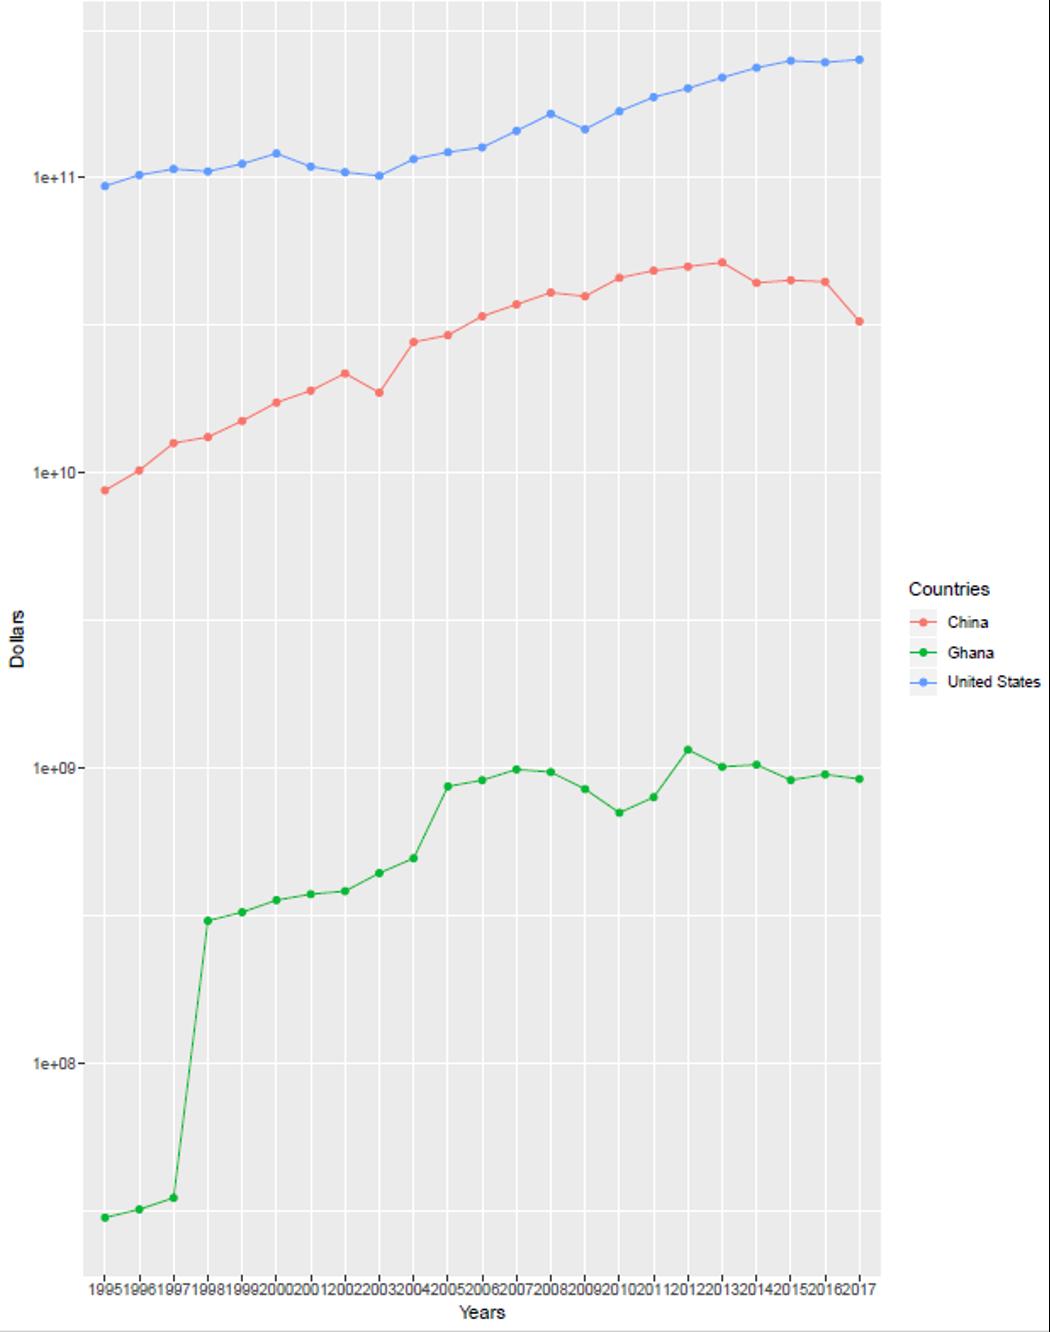
tourism_plot("China", "Ghana", "United States")
Expert Answer:
Step 1 Download and Load the Dataset Assuming youve downloaded the dataset and saved it as touri... View the full answer


Modern Systems Analysis And Design
ISBN: 9780134204925
8th Edition
Authors: Joseph Valacich, Joey George
