

Question: Part one: Cluster analysis In this section we will only use the Synthea observations data. Start by using the code below to clear the R
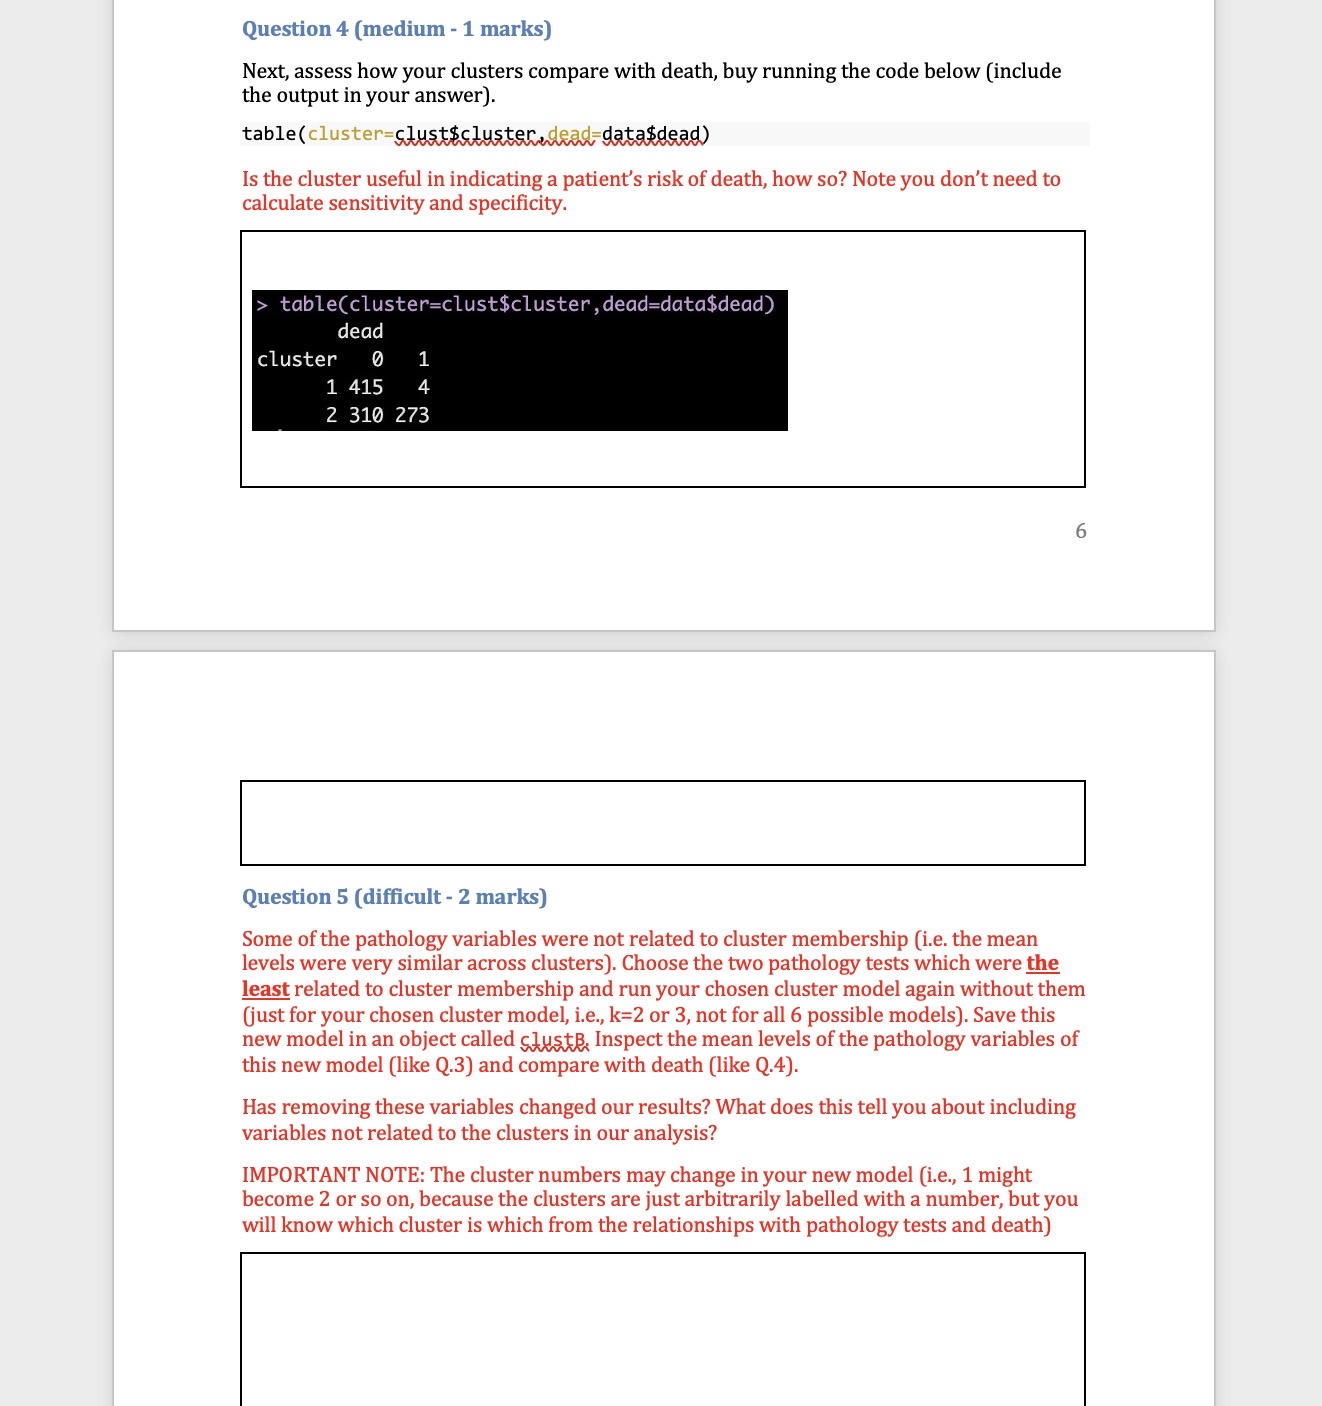
![table(cluster=clust$cluster,dead=data$dead) dead cluster ] 1 1415 4 2 310 273 Question 5](https://dsd5zvtm8ll6.cloudfront.net/si.experts.images/questions/2024/10/671cbdd8542a0_856671cbdd81c273.jpg)
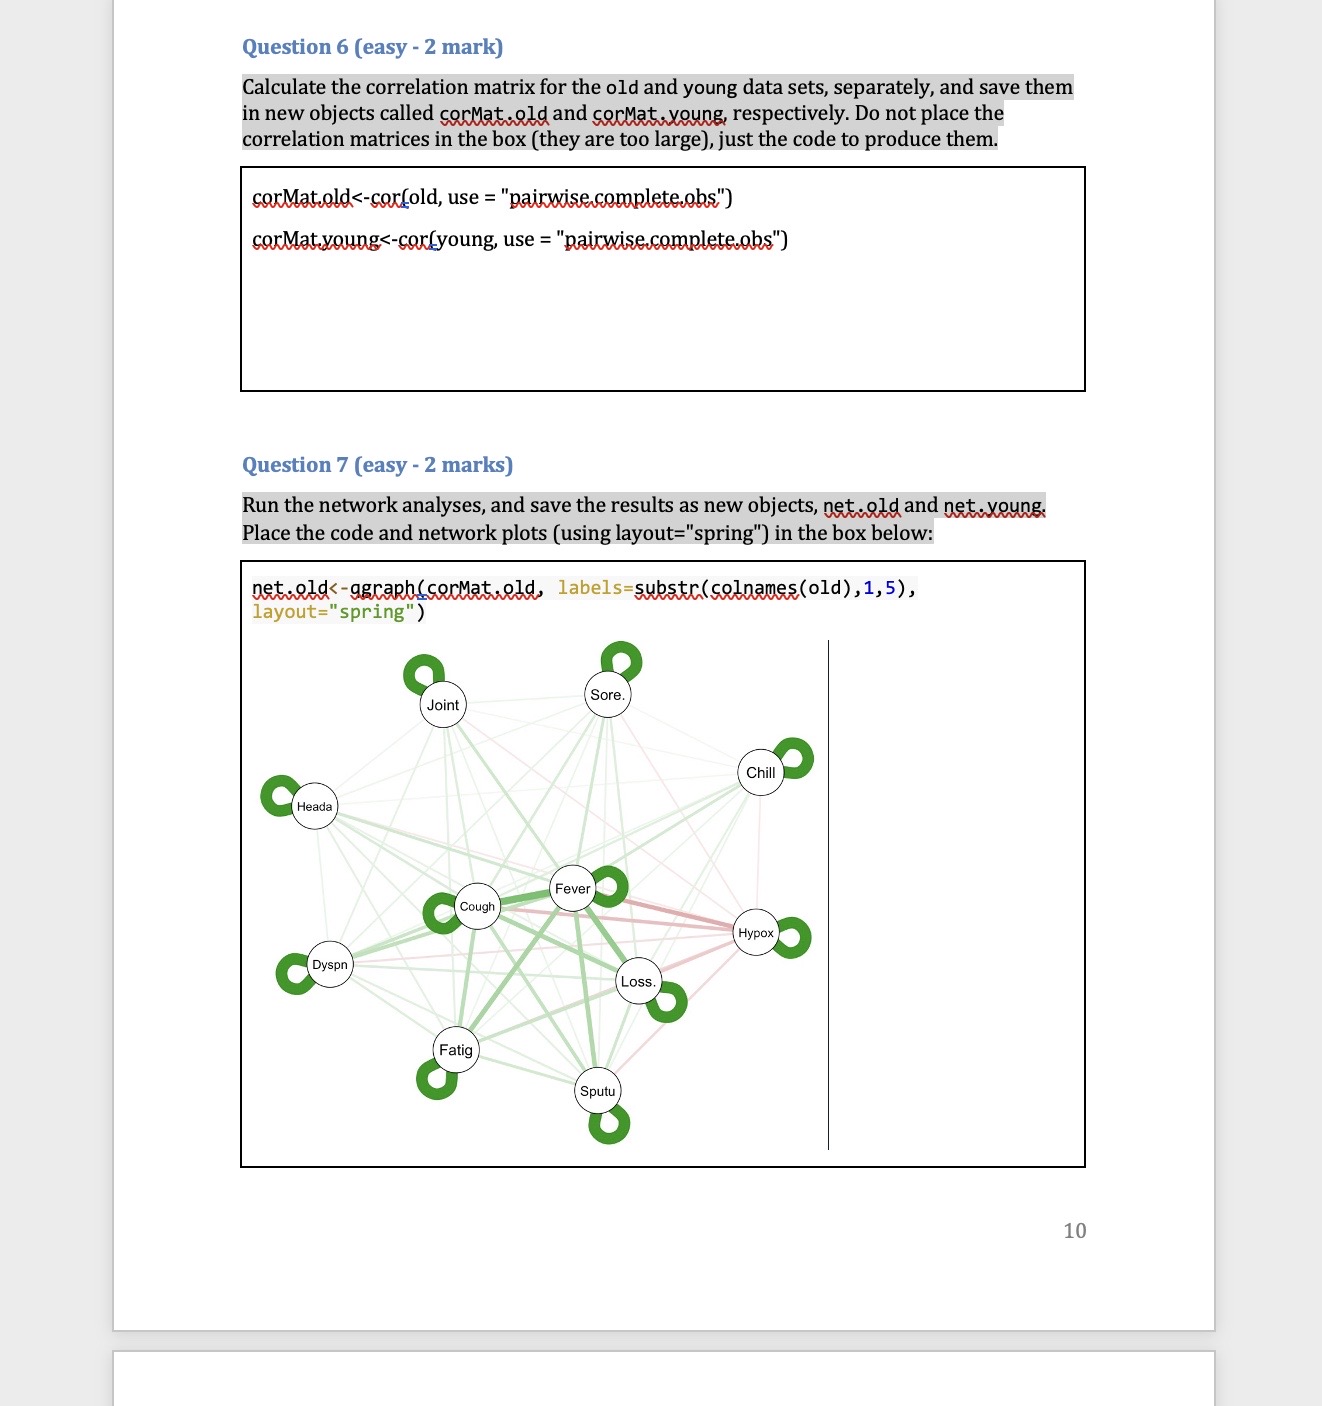
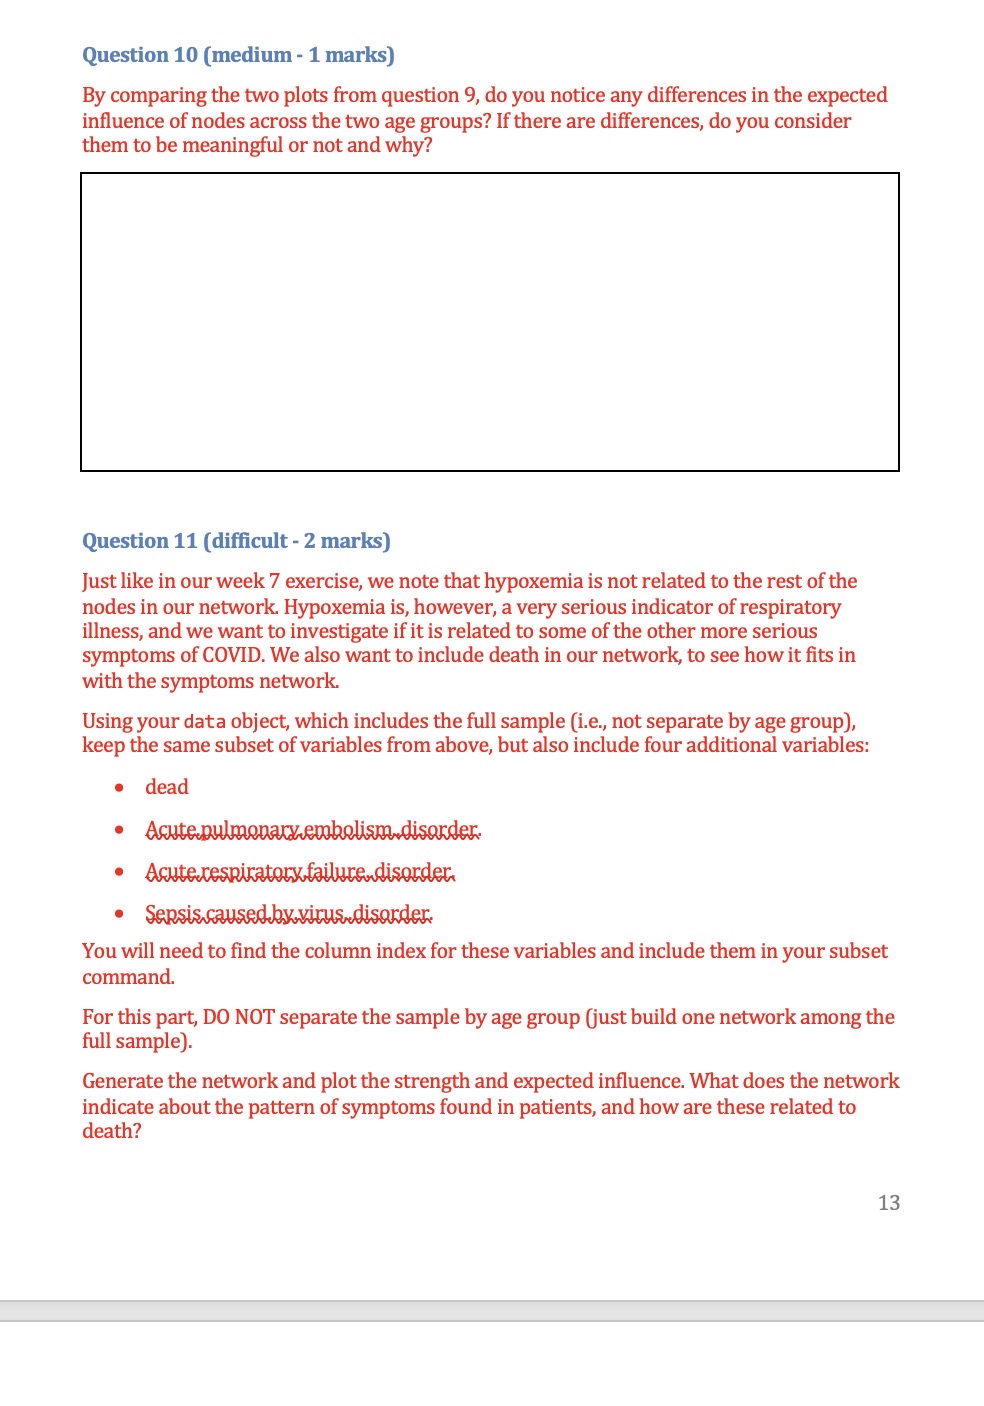
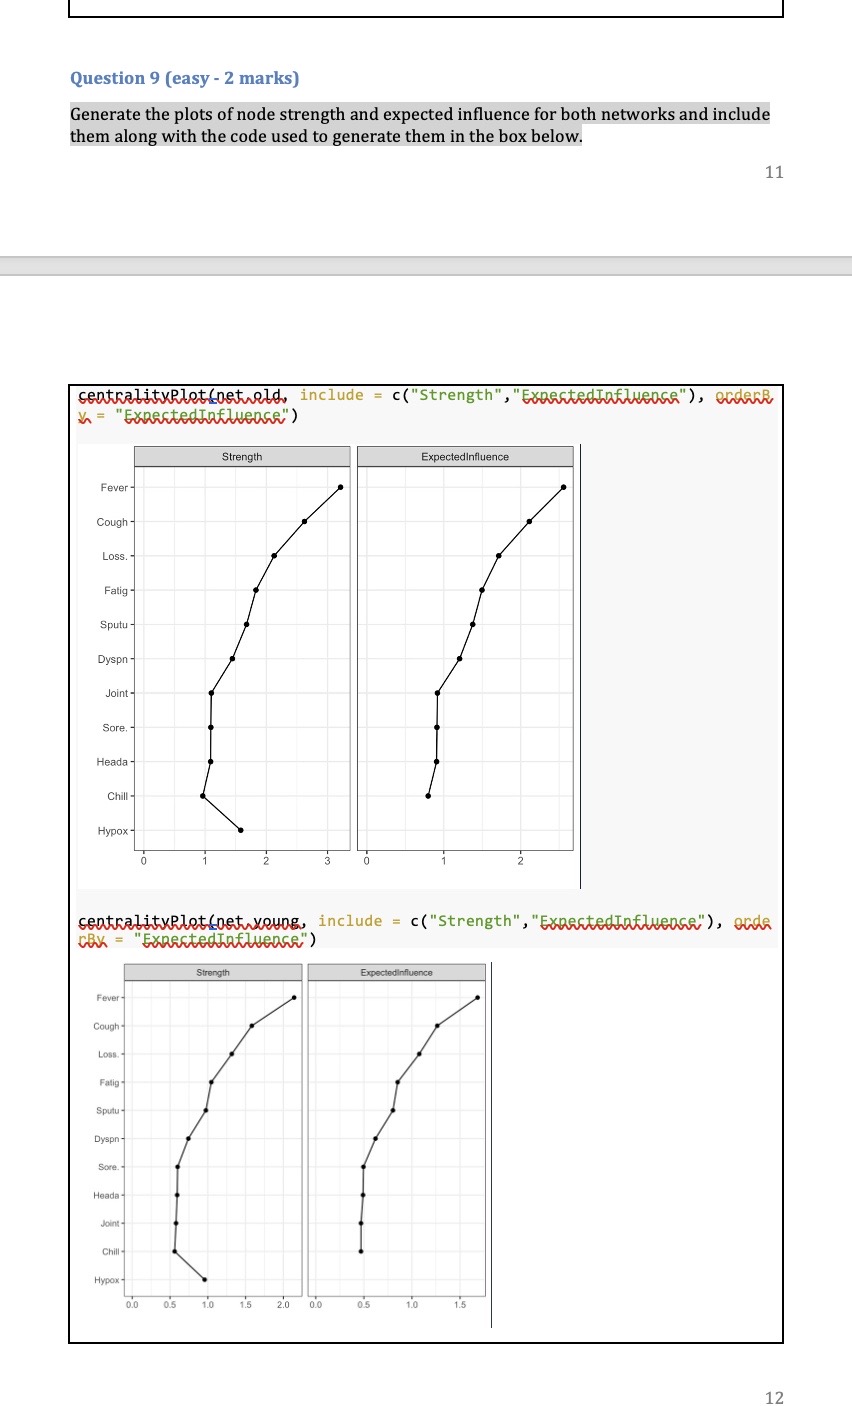
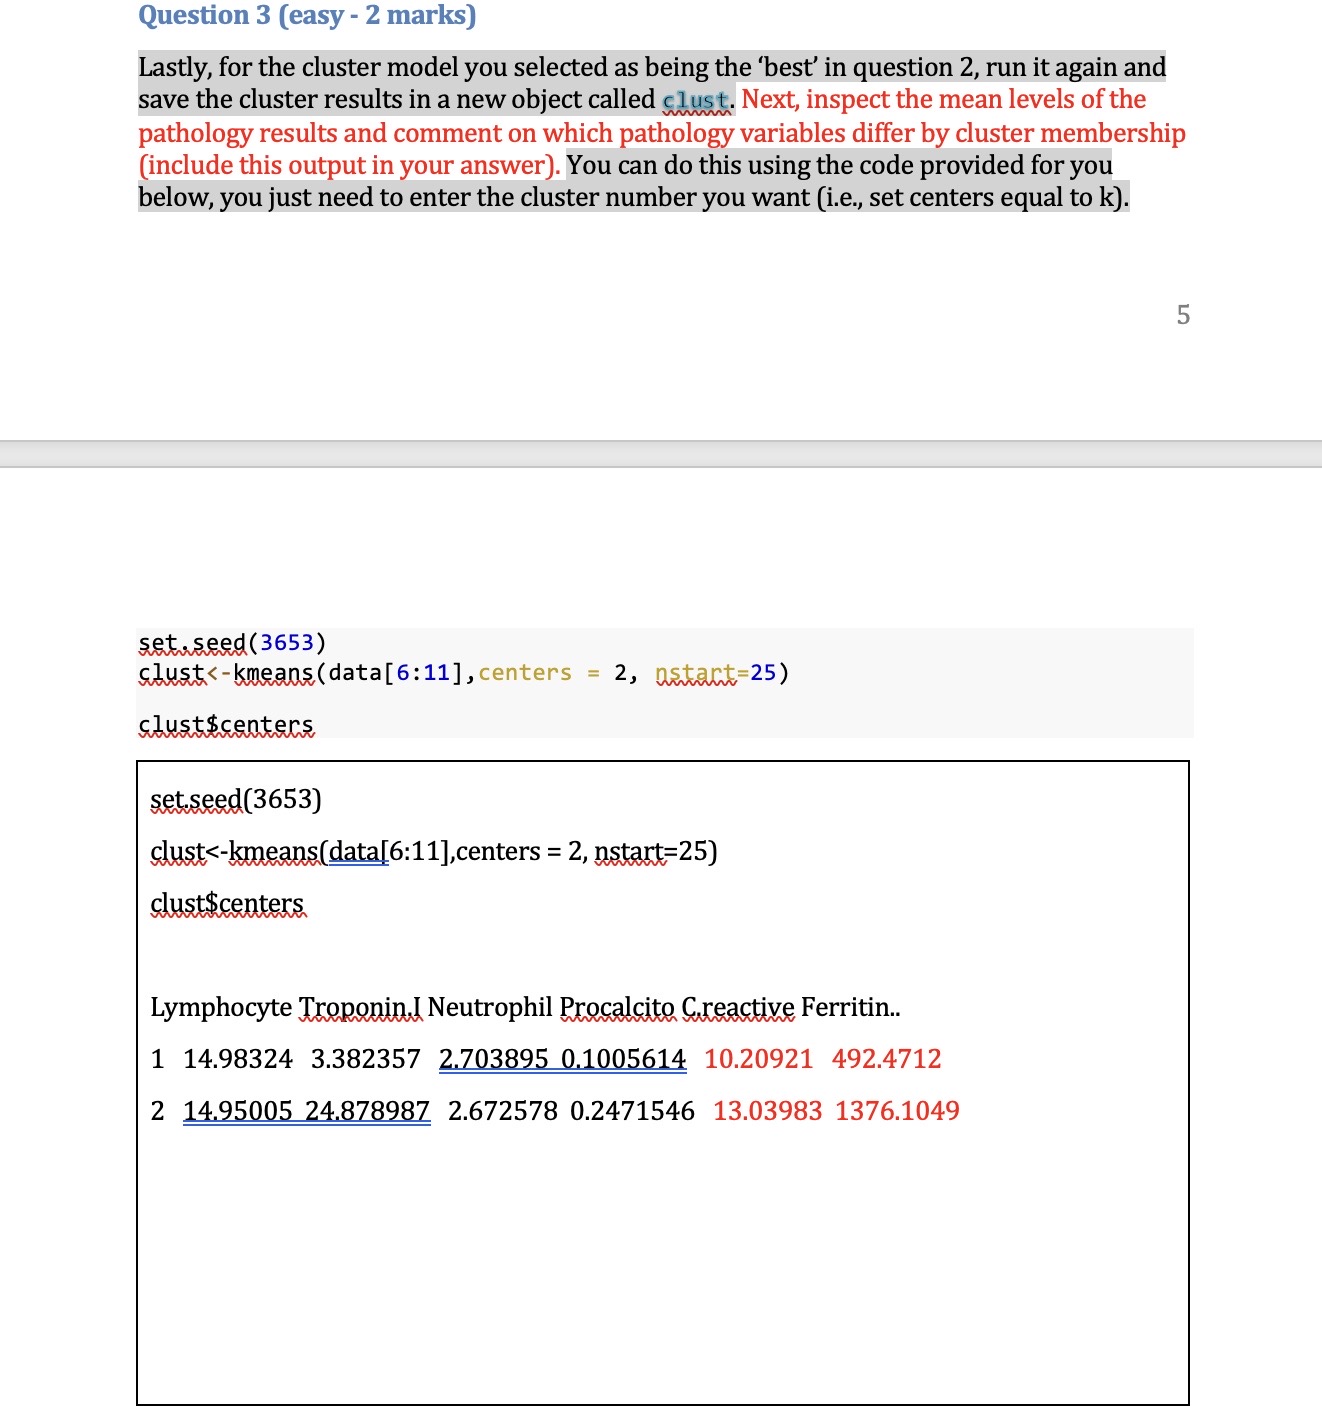
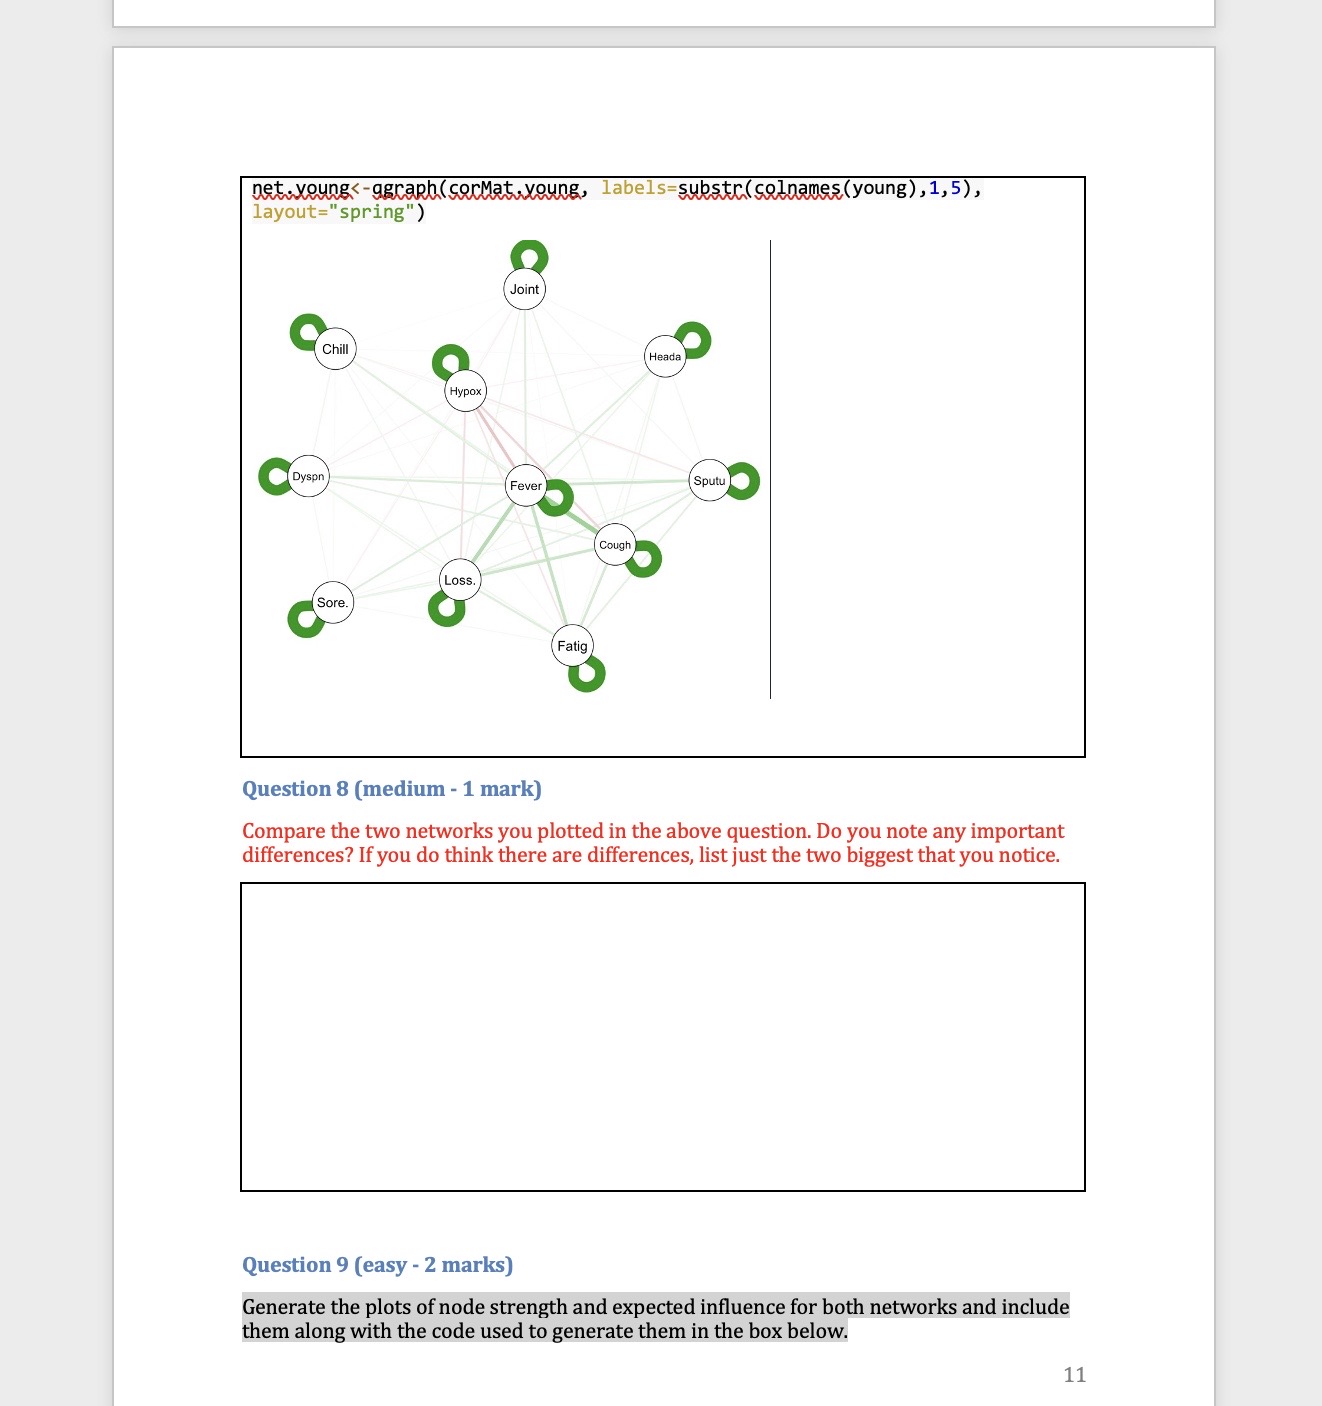
Part one: Cluster analysis In this section we will only use the Synthea observations data. Start by using the code below to clear the R global environment, load the observations data, make a data object with a small number of variables and remove all missing values, remove patients who did not have COVID 19, truncate the variable names, and load the package factoextra which we use for k-means cluster analysis. As always you will need to set your working directory. rm(list=1s()) obs data table(cluster=clust$cluster,dead=data$dead) dead cluster ] 1 1415 4 2 310 273 Question 5 (difficult - 2 marks) Some of the pathology variables were not related to cluster membership (i.e. the mean levels were very similar across clusters). Choose the two pathology tests which were the least related to cluster membership and run your chosen cluster model again without them (just for your chosen cluster model, i.e.,, k=2 or 3, not for all 6 possible models). Save this new model in an object called gluskB, Inspect the mean levels of the pathology variables of this new model (like Q.3) and compare with death (like Q.4). Has removing these variables changed our results? What does this tell you about including variables not related to the clusters in our analysis? IMPORTANT NOTE: The cluster numbers may change in your new model (i.e,, 1 might become 2 or so on, because the clusters are just arbitrarily labelled with a number, but you will know which cluster is which from the relationships with pathology tests and death) net.youngs-agraphlserMat,young, labels=substr(colnames(young),1,5), | Joint :II : Chill\\I Hypox layout="spring") Question 8 (medium - 1 mark) Compare the two networks you plotted in the above question. Do you note any important differences? If you do think there are differences, list just the two biggest that you notice. Question 9 (easy - 2 marks) Generate the plots of node strength and expected influence for both networks and include them along with the code used to generate them in the box below. 11 Part Two: Network analysis In this section we will mostly use the Synthea conditions data. Start by using the code below to clear the R global environment of any data you still have from the last section, load the conditions data, make a data object with a smaller number of variables, remove patients who did not have COVID 19, truncate the variable names, and load the package ggraph which we use for network analysis. NOTE: if you have closed R since the last activity you will need to set your working directory again. rm(list=1s()) ohs. data=50) , ] old
Step by Step Solution
There are 3 Steps involved in it

Get step-by-step solutions from verified subject matter experts