

Question: Part One: Graphing and Descriptive Statistics 1. Prepare afrequency distribution f frequency table of Salary-mil; use a category width of 10 million dollars; Using the
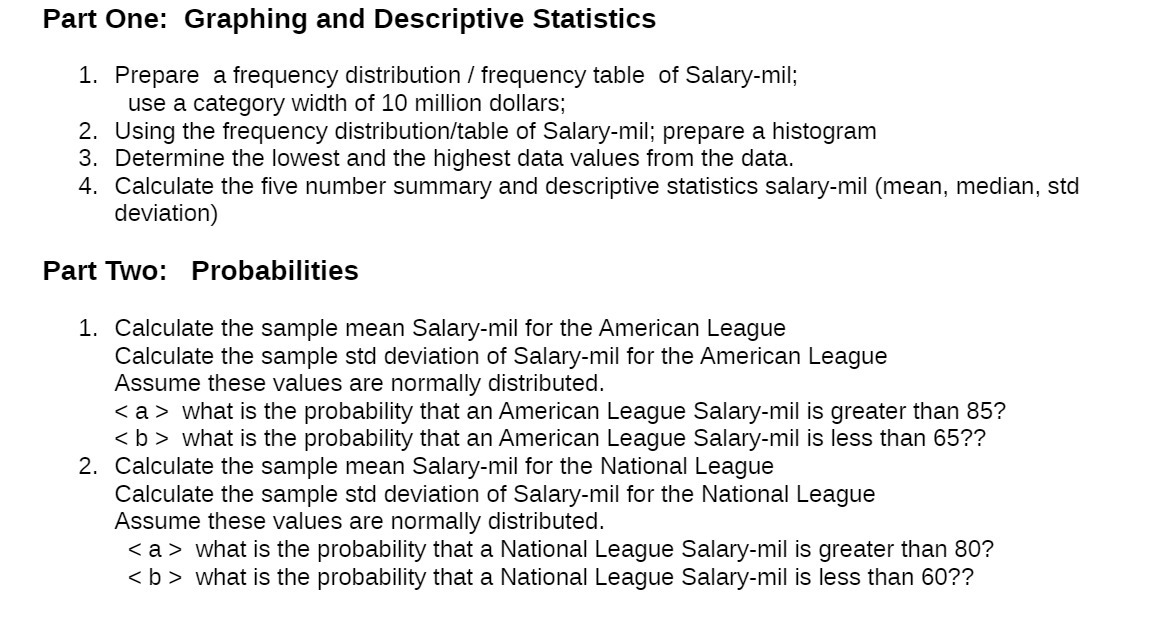
Part One: Graphing and Descriptive Statistics 1. Prepare afrequency distribution f frequency table of Salary-mil; use a category width of 10 million dollars; Using the frequency distributionltable of Salary-mil; prepare a histogram Determine the lowest and the highest data values from the data. Calculate the five number summary and descriptive statistics salary-mil (mean. median, std deviation) PP)!\" Part Two: Probabilities 1. Calculate the sample mean Salary-mil for the American League Calculate the sample std deviation of Salary-mil for the American League Assume these values are normally distributed. what is the probability that an American League Salary-mil is greater than 85? what is the probability that an American League Salary-mil is less than 65?? 2. Calculate the sample mean Salary-mil for the National League Calculate the sample std deviation of Salary-mil for the National League Assume these values are normally distributed. what is the probability that a National League Salary-mil is greater than 80? what is the probability that a National League Salary-mil is less than 60
Step by Step Solution
There are 3 Steps involved in it

Get step-by-step solutions from verified subject matter experts