

Question: Part One: Part Two: Part Three: Please provide Excel formulas too if possible. I am stuck and struggling and could use any help at all.
Part One:
Part Two:
Part Three:
Please provide Excel formulas too if possible. I am stuck and struggling and could use any help at all. Thank you!!!!
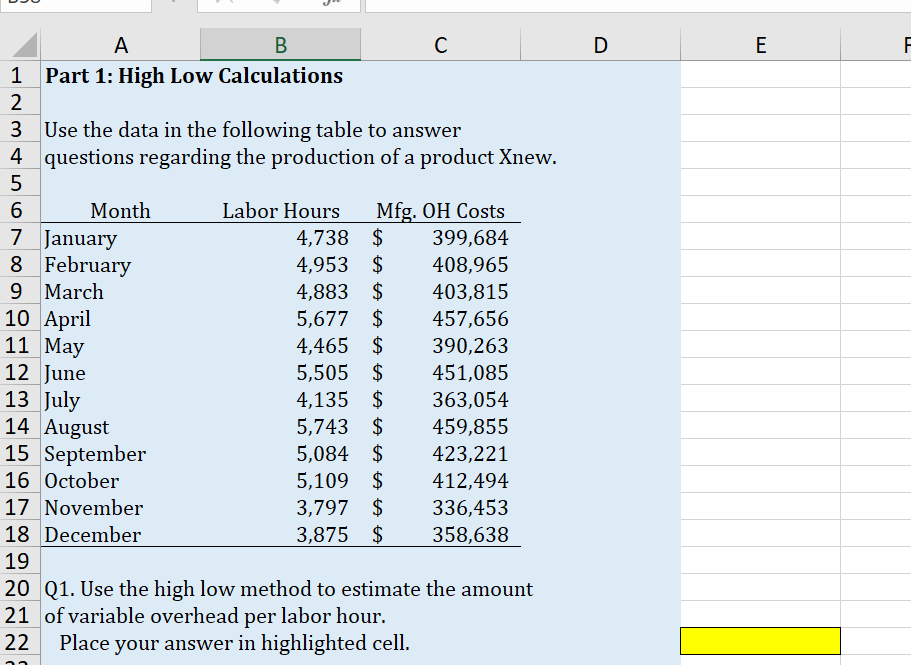
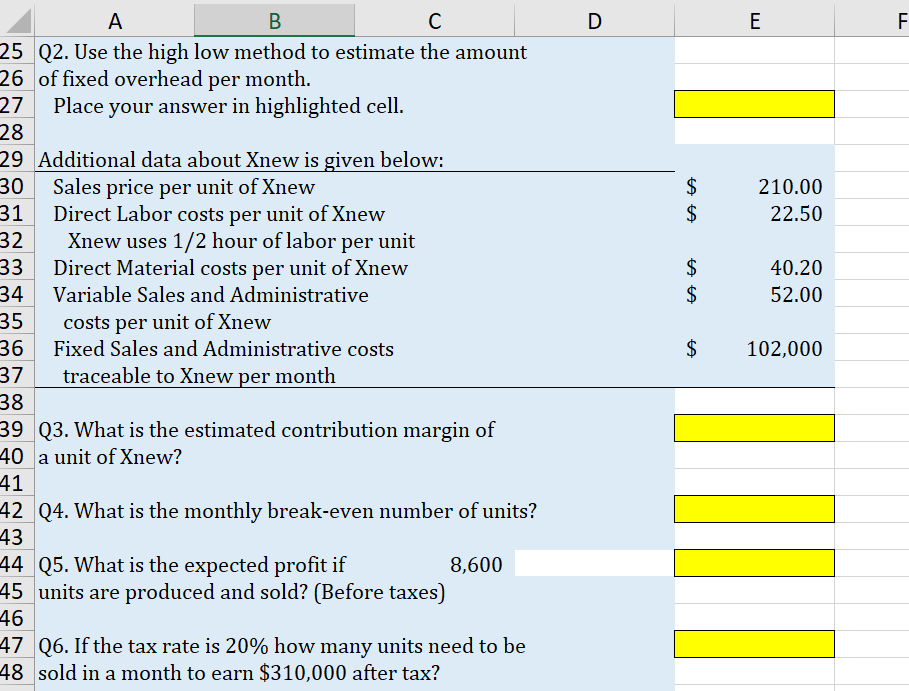
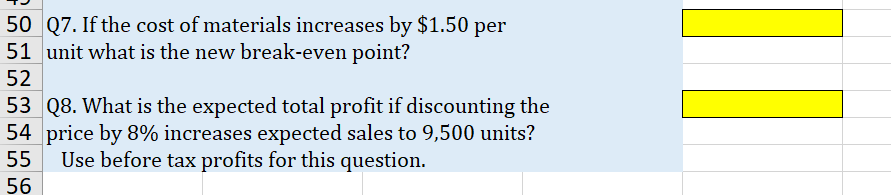
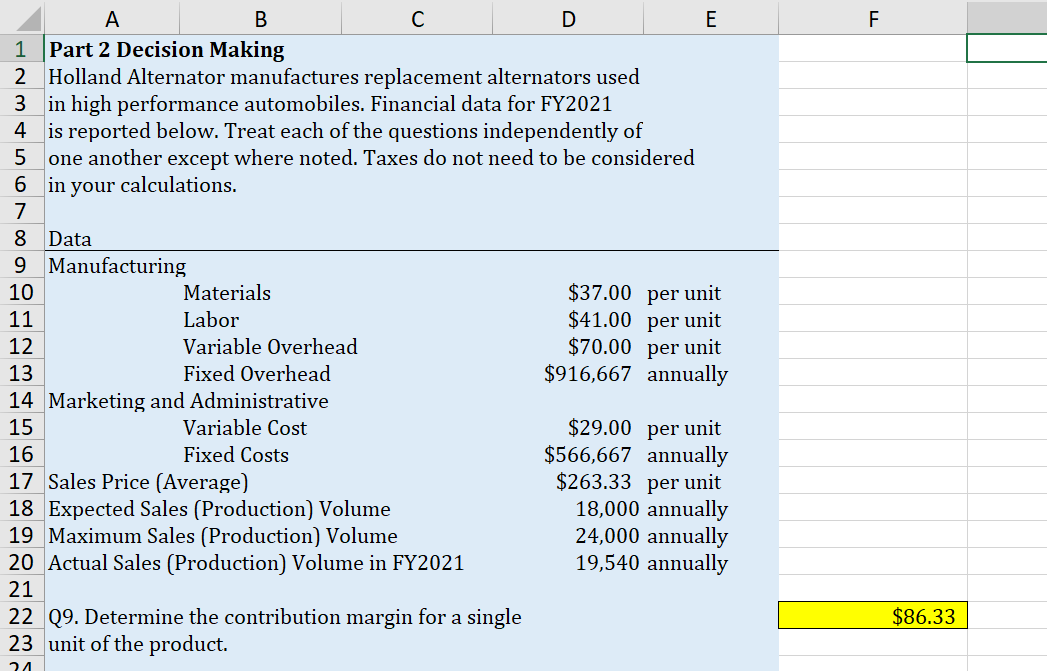
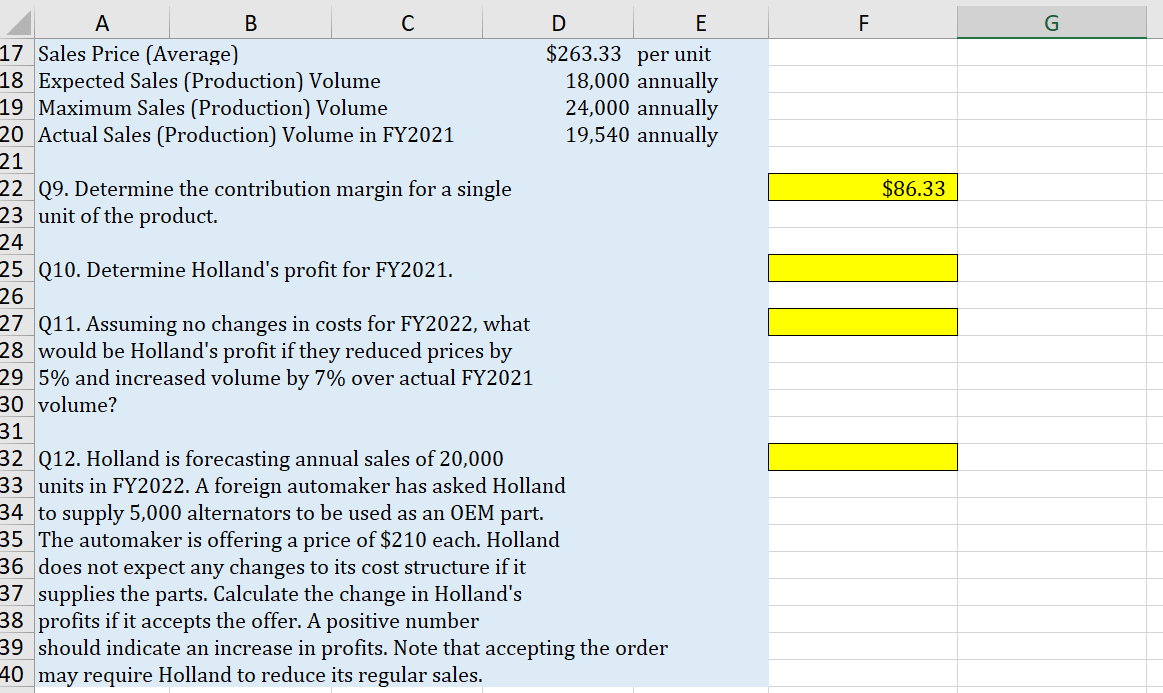
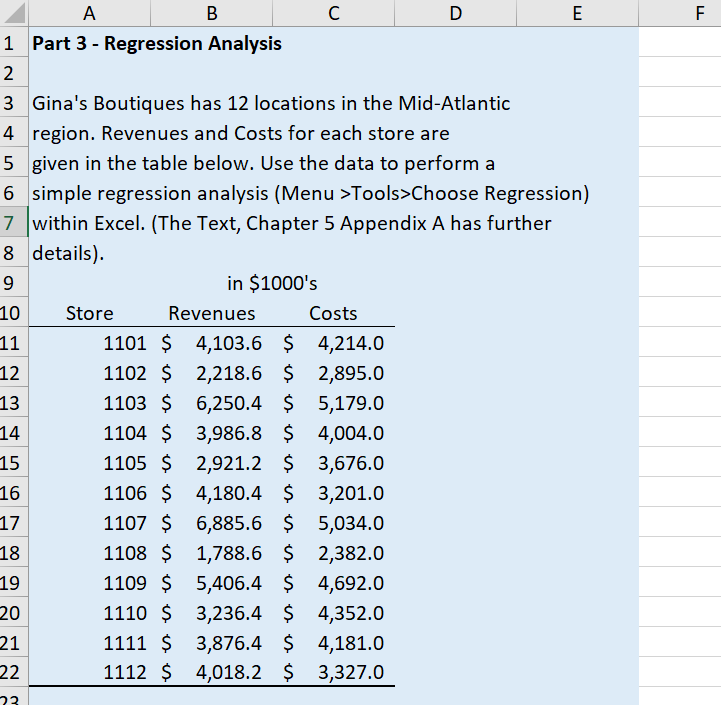
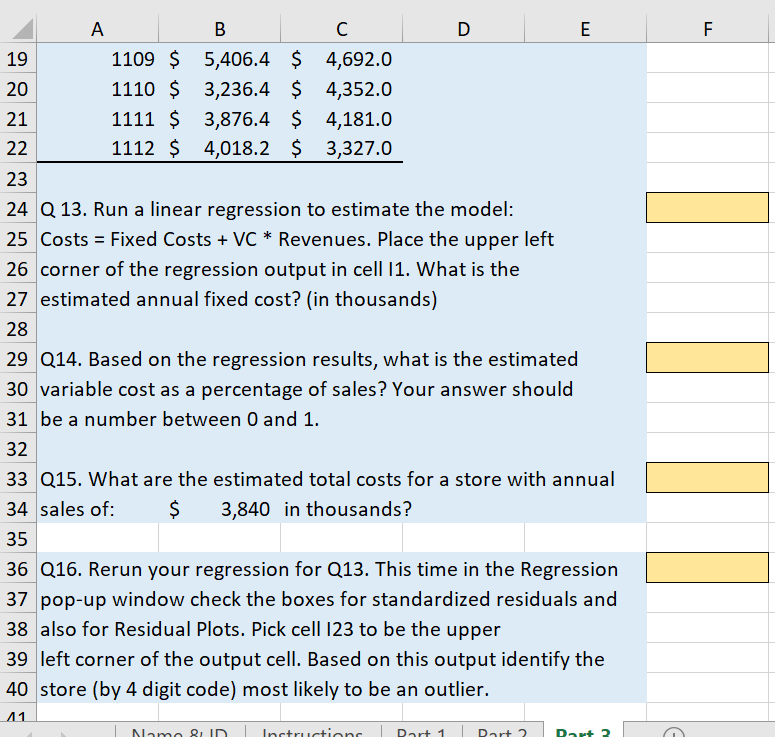
Part 1: High Low Calculations Use the data in the following table to answer questions regarding the production of a product Xnew. Q1. Use the high low method to estimate the amount of variable overhead per labor hour. Place your answer in highlighted cell. \begin{tabular}{l|l|l|} \hline & \multicolumn{1}{c}{ A } \\ 225 & Q2. Use the high low method to estimate the amount \\ 26 & of fixed overhead per month. \\ 27 & Place your answer in highlighted cell. \\ \hline 28 & & \end{tabular} 50 Q7. If the cost of materials increases by $1.50 per 51 unit what is the new break-even point? 52 53 Q8. What is the expected total profit if discounting the 54 price by 8\% increases expected sales to 9,500 units? 55 Use before tax profits for this question. Part 3 - Regression Analysis Gina's Boutiques has 12 locations in the Mid-Atlantic region. Revenues and Costs for each store are given in the table below. Use the data to perform a simple regression analysis (Menu > Tools > Choose Regression) within Excel. (The Text, Chapter 5 Appendix A has further details). Q 13. Run a linear regression to estimate the model: Costs = Fixed Costs +VC Revenues. Place the upper left corner of the regression output in cell I1. What is the estimated annual fixed cost? (in thousands) Q14. Based on the regression results, what is the estimated variable cost as a percentage of sales? Your answer should be a number between 0 and 1 . Q15. What are the estimated total costs for a store with annual sales of: $3,840 in thousands? Q16. Rerun your regression for Q13. This time in the Regression pop-up window check the boxes for standardized residuals and also for Residual Plots. Pick cell 123 to be the upper left corner of the output cell. Based on this output identify the store (by 4 digit code) most likely to be an outlier. Part 1: High Low Calculations Use the data in the following table to answer questions regarding the production of a product Xnew. Q1. Use the high low method to estimate the amount of variable overhead per labor hour. Place your answer in highlighted cell. \begin{tabular}{l|l|l|} \hline & \multicolumn{1}{c}{ A } \\ 225 & Q2. Use the high low method to estimate the amount \\ 26 & of fixed overhead per month. \\ 27 & Place your answer in highlighted cell. \\ \hline 28 & & \end{tabular} 50 Q7. If the cost of materials increases by $1.50 per 51 unit what is the new break-even point? 52 53 Q8. What is the expected total profit if discounting the 54 price by 8\% increases expected sales to 9,500 units? 55 Use before tax profits for this question. Part 3 - Regression Analysis Gina's Boutiques has 12 locations in the Mid-Atlantic region. Revenues and Costs for each store are given in the table below. Use the data to perform a simple regression analysis (Menu > Tools > Choose Regression) within Excel. (The Text, Chapter 5 Appendix A has further details). Q 13. Run a linear regression to estimate the model: Costs = Fixed Costs +VC Revenues. Place the upper left corner of the regression output in cell I1. What is the estimated annual fixed cost? (in thousands) Q14. Based on the regression results, what is the estimated variable cost as a percentage of sales? Your answer should be a number between 0 and 1 . Q15. What are the estimated total costs for a store with annual sales of: $3,840 in thousands? Q16. Rerun your regression for Q13. This time in the Regression pop-up window check the boxes for standardized residuals and also for Residual Plots. Pick cell 123 to be the upper left corner of the output cell. Based on this output identify the store (by 4 digit code) most likely to be an outlier
Step by Step Solution
There are 3 Steps involved in it

Get step-by-step solutions from verified subject matter experts