

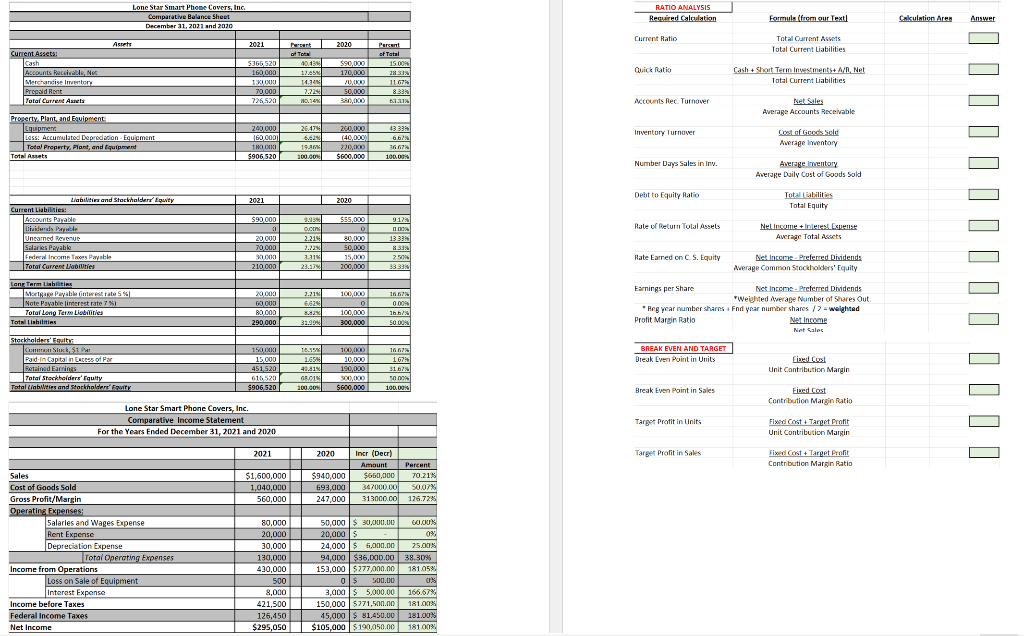
Question: Part One: The Excel file titled Lone Star Analysis Sheets contains financial information for 2021 and 2020. 1. Prepare a Comparative Balance Sheet with vertical
Part One: The Excel file titled Lone Star Analysis Sheets contains financial information for 2021 and 2020. 1. Prepare a Comparative Balance Sheet with vertical analysis (required columns added). Tab 1 2. Prepare a Comparative Income Statement with horizontal analysis (required columns added). Tab 2 3. Based on the financial information given: calculate the following 2021 ratios for the company (formulas are shown, but you are to show calculations and answers) Tab 3. To aid in your analysis the Smart Phone covers industry ratios are provided as a comparison resource. Depending on the Case (A, B or C) assume the industry ratios below.
Current Ratio 1.75
Quick Ratio 1.50
Accts Receivable Turnover 8.30
Inventory Turnover 12.00
Number of Days Sales in Inventory 30.00
Debit Equity Ratio .45
Rate earned on Total Assets 32.60%
Rate earned on Stockholders's Equity 44.30%
Earnings Per share (Add shared sold on Jan 1, 2021) $1.33
Profit Margin Ratio 15.30%
4.
Calculate the expected 2022 Income from operations break-even point and for a target profit of $600,000 (calculate units and dollars of sales) Tab 3. Round to the nearest unit and dollar. For purposes of calculating the break-even point and target profit use the information below: (only use your Case info)
Unit Sales Price $16.00
Unit Variable Cost $10.40
Fixed Cost - use $130,000 for all
Step by Step Solution
There are 3 Steps involved in it

Get step-by-step solutions from verified subject matter experts